Figure 3.
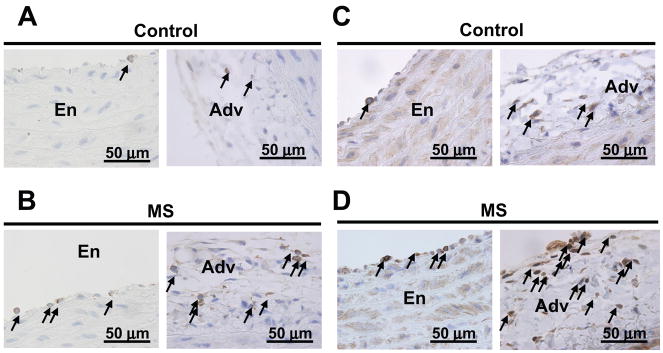
Localization of inflammatory cells in aortic tissue from ang II-infused rats. Panels 3A and 3B: representative micrographs of CD68 positive cells in ang II-infused control, C (3A) and maternally separated, MS (3B) rats, respectively. Panels 3C and 3D: representative micrographs of CD3 positive cells in ang II-infused control, C (3C) and maternally separated, MS (3D) rats, respectively. Arrows point to CD68 or CD3 positive cells in the endothelium (En) or adventitia (Adv).

