
Figure 2.
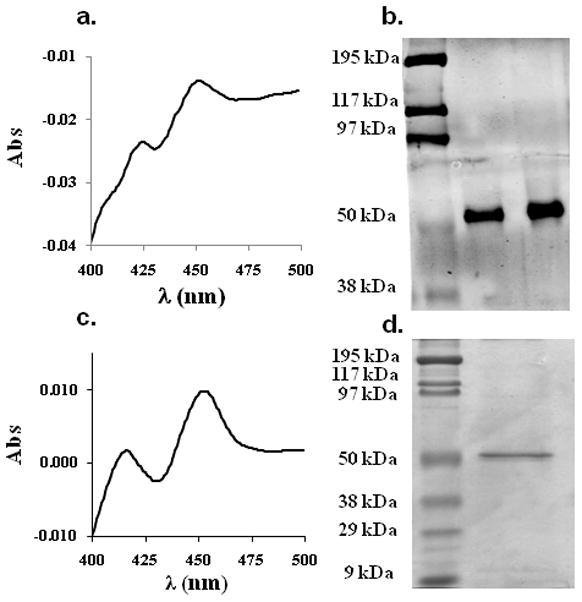
Characterization of CYP26A1 microsomes and purified CYP26A1. Panel (a.) shows the CO difference spectrum of the CYP26A1 microsomes with a peak at 450 nm, panel (b.) shows a western blot of CYP26A1 microsomes probed with antiCYP26A1 antibody, panel (c.) shows a CO difference spectrum of the purified CYP26A1 and panel (d.) a Coomassie stained SDS-page gel of the purified CYP26A1. Approximately 3 pmoles of the purified CYP26A1 were loaded on the gel in (d.).