
Figure 6.
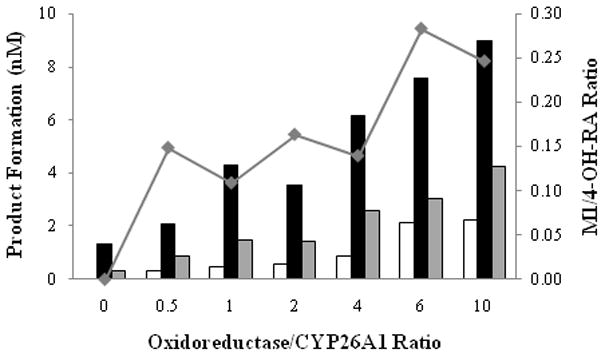
Effect of cytochrome P450 oxidoreductase on retinoic acid turnover by CYP26A1. All incubations were conducted for 30 seconds in the presence of NADPH and 100 nM RA. The formation of M1 (white bars), 4-OH-RA (black bars) and M5 (gray bars) is shown. Additionally, the M1/4-OH-RA ratio at each OR/CYP ratio is depicted (◆).