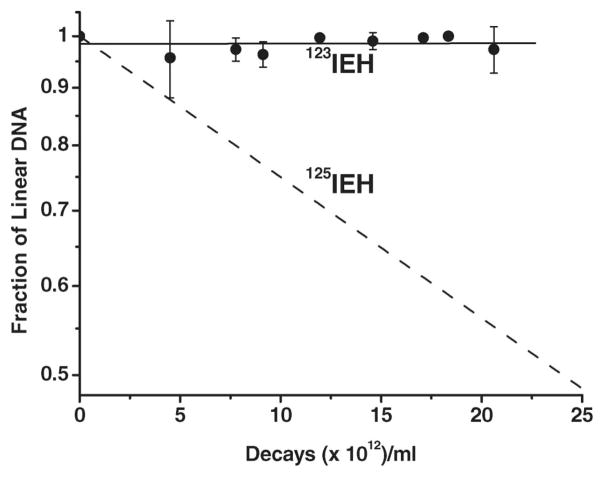
Figure 4.
Quantitative analysis of data obtained from agarose gel electrophoresis indicating disappearance of L 3H-pUC19 plasmid DNA after exposure to 123IEH (●). Error bars are the standard deviation of the mean for three independent experiments. Dotted line shows rate of disappearance of L DNA exposed to 125IEH decays (Balagurumoorthy et al. 2008).

