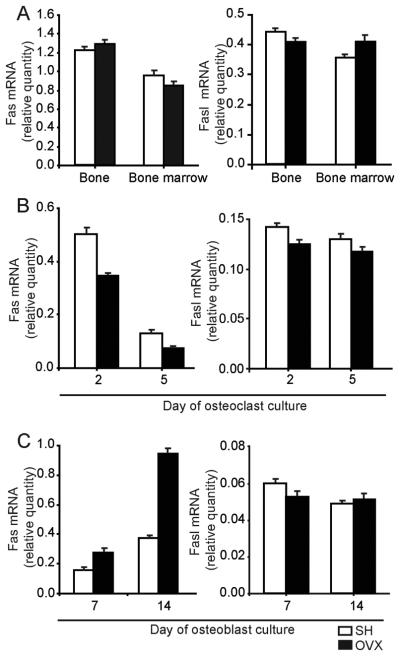
Figure 1. Gene expression of Fas and Fasl in bone, bone marrow, osteoblast, and osteoclast lineage cells in wild-type mice 4 weeks after ovariectomy (OVX).
(A) Expression of Fas/Fasl mRNA in bone and bone marrow. (B) Expression of Fas/Fasl mRNA in osteoclastogenic cultures. (C) Expression of Fas/Fasl mRNA in osteoblastogenic cultures. Expression was calculated according to the standard curve for Fas/Fasl expression in the calibrator sample (cDNA from bone, bone marrow, osteoblastogenic or osteoblastogenic cultures), and normalized to the mRNA quantity for β-actin (“endogenous” control). Results are arithmetic mean±SD of real-time PCR reaction duplicates prepared from the same sample of the representative experiment.

