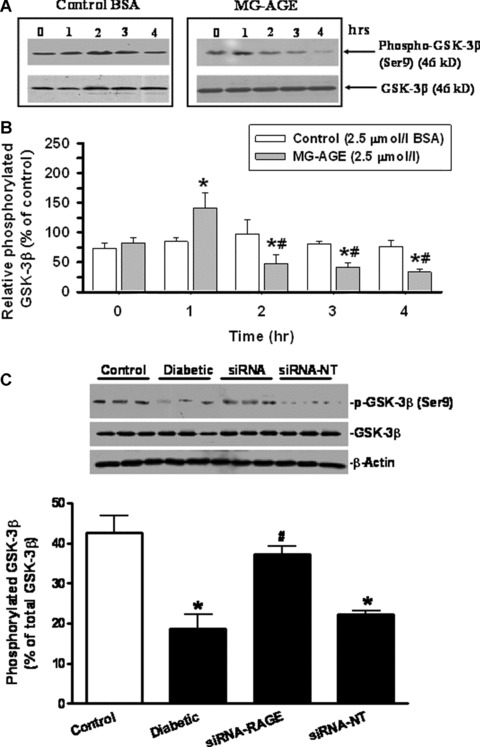
Figure 6.

Time‐dependent phosphorylation of GSK‐3 β (serine‐9) in response to MG‐AGE and control BSA (2.5 μmol/l). (A) GSK‐3β phosphorylation by BSA and MG‐AGE (0–4 hrs); (B) Pooled data of GSK‐3 β phosphorylation in control myocytes; (C) pooled data of GSK‐3β phosphorylation in control and diabetic hearts treated with siRNA‐RAGE or siRNA‐NT. Inset: Representative gels of GSK‐3β phosphorylation using specific antibodies. Mean ± S.E.M., n= 4, *P < 0.05 versus BSA or control group, # P < 0.05 versus MG‐AGE at time 0 or diabetic group.
