
Figure 1. Overall survival dichotomized by treatment type.
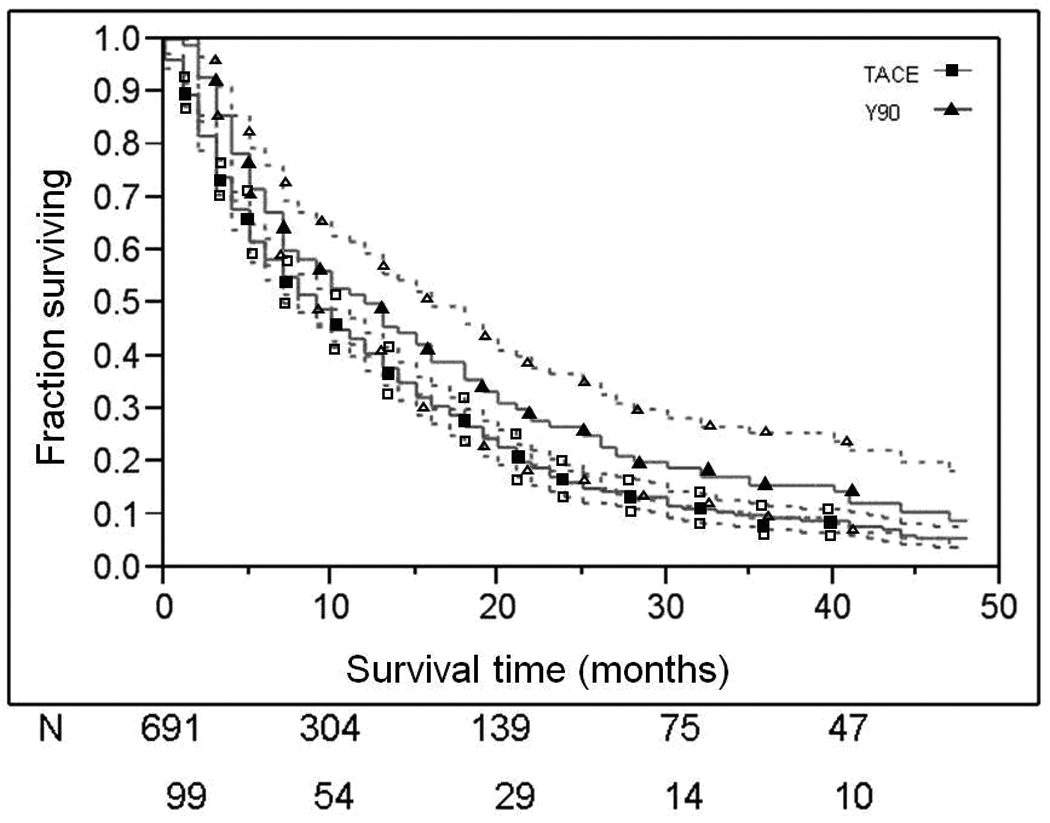
Patient survival curves dichotomized by treatment type. 95% CI are presented as dotted lines. Numbers of patients at risk at each time interval have been provided for TACE and Y90 treatment groups. The top line represents TACE and the bottom Y90.