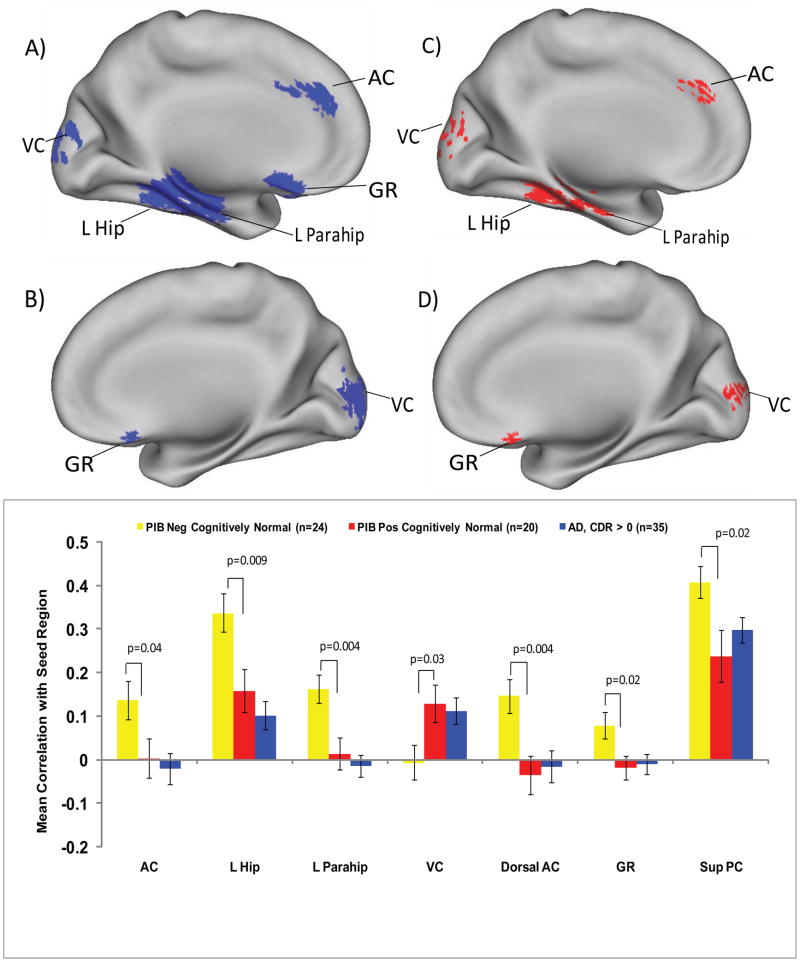
Figure 1. Altered Functional Connectivity to the Precuneus.
All images are shown in medial sagittal section and identify statistically significant regional differences in functional connectivity of the precuneus between AD and (PIB−) cognitively normal individuals (blue) and between (PIB+) and (PIB−) cognitively normal individuals (red). The top left (1a) and right (1c) images display the left medial surfaces in AD vs PIB− and PIB+ vs PIB− participants, respectively. The second row left (1b) and right (1d) images display the right medial sagittal surfaces in the AD vs PIB− and PIB+ vs PIB− participants, respectively. The regions identified were in visual cortex-(VC) (both L and R), L hippocampus—(L hip), L parahippocampus—(L parahip), L anterior cingulate (AC), L (AD only) and R gyrus rectus (GR)(both groups). For brevity, not shown are the dorsal cingulate (DC) and superior precuneus (sup PC) regions. The graph compares regional correlation magnitudes for AD, PIB+ and PIB− individuals. *p-values denote significant differences in connectivity between (PIB+) and (PIB−) groups.

