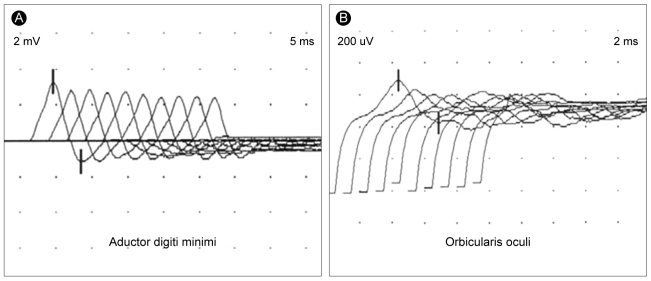
Figure 3.
Electromyography of abductor digiti minimi and orbicularis oculi muscle. (A) These findings demonstrate a decrement in the compound muscle action potential amplitude of about 20% at 2 Hz stimulation at the abductor digiti minimi muscle and (B) more than 70% at 5 Hz stimulation at orbicularis oculi muscle.

