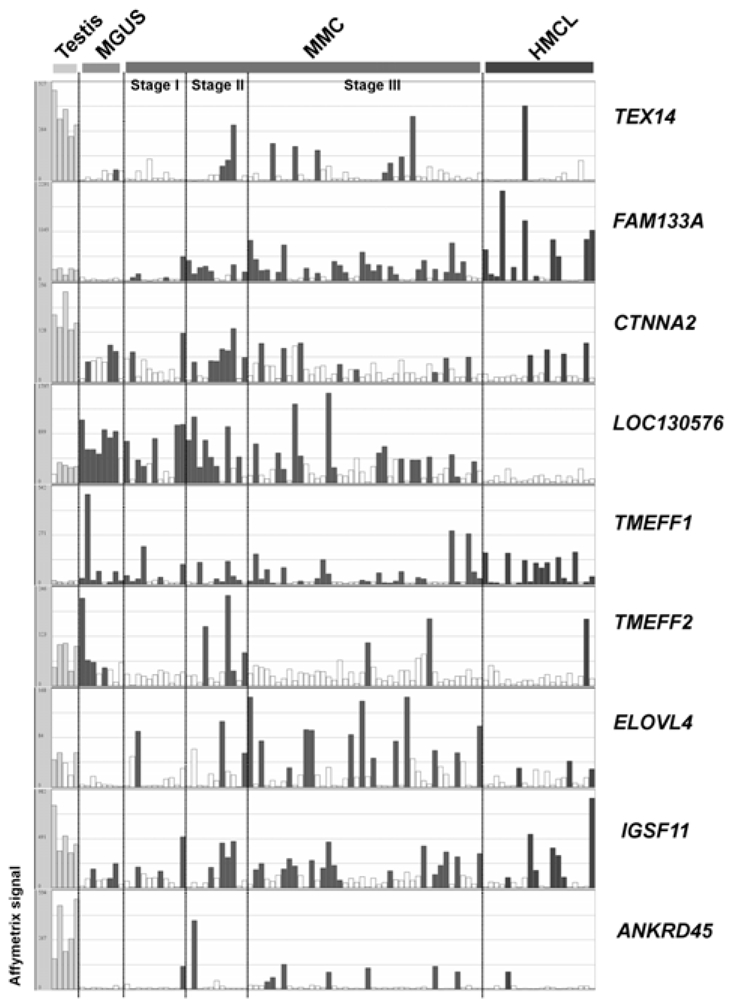
Figure 4. Gene expression profiles of 9 novel CT genes in MGUS and MM samples measured by Affymetrix HG-U133 Set arrays.

Histograms show the expression level of 9 tissue-restricted CT genes in five testis samples, eight purified plasma cell samples from patients with monoclonal gammopathy with undetermined significance (MGUS), 64 MMC samples from patients with multiple myeloma (MMC) ordered in stages (I, II, III) and 20 human myeloma cell lines (HMCL) samples. The signal intensity for each gene is shown on the Y axis as arbitrary units determined by the GCOS 1.2 software (Affymetrix). Empty histograms indicate an “Absent” Affymetrix call and filled histograms a “Present” Affymetrix call.
