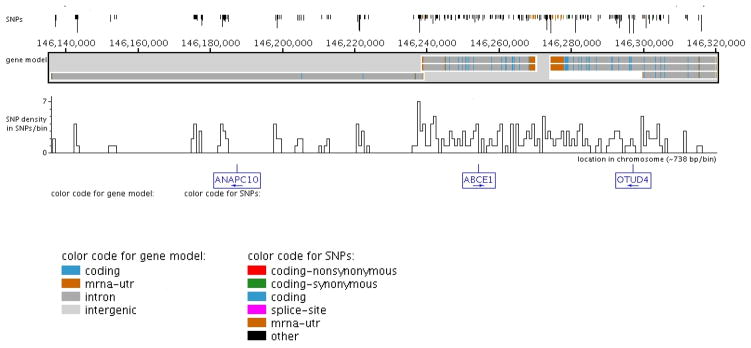
Figure 1. Location and density of SNPs discovered across ANAPC10, ABCE1, and OTUD4 on chromosome 4 the Yoruban population.
Candidate genes were re-sequenced in 12 Yoruban DNA samples (NA18502, NA19238, NA18504, NA18870, NA1855, NA19137, NA19201, NA19200, NA19203, NA19223, NA19153, and NA19144) for variation discovery. All ABCE1 and OTUD4 introns and exons were targeted for re-sequencing while ANAPC10 exons and representative intronic sequence was targeted for variation discovery. The presence of a SNP and its frequency are denoted by the vertical lines at the top of the figure generated by the Genome Variation Server (http://gvs.gs.washington.edu/GVS/). The lines are color coded to correspond with the gene model for each candidate gene (for example, orange represents the untranslated region of a gene). The graph below the gene model represents the SNP density per ~738 basepairs across this genomic region. Candidate genes and their direction are labeled at the bottom of the figure. All DNA variations were deposited into dbSNP and GenBank (accession numbers DQ304649, DQ148409, and DQ427109)

