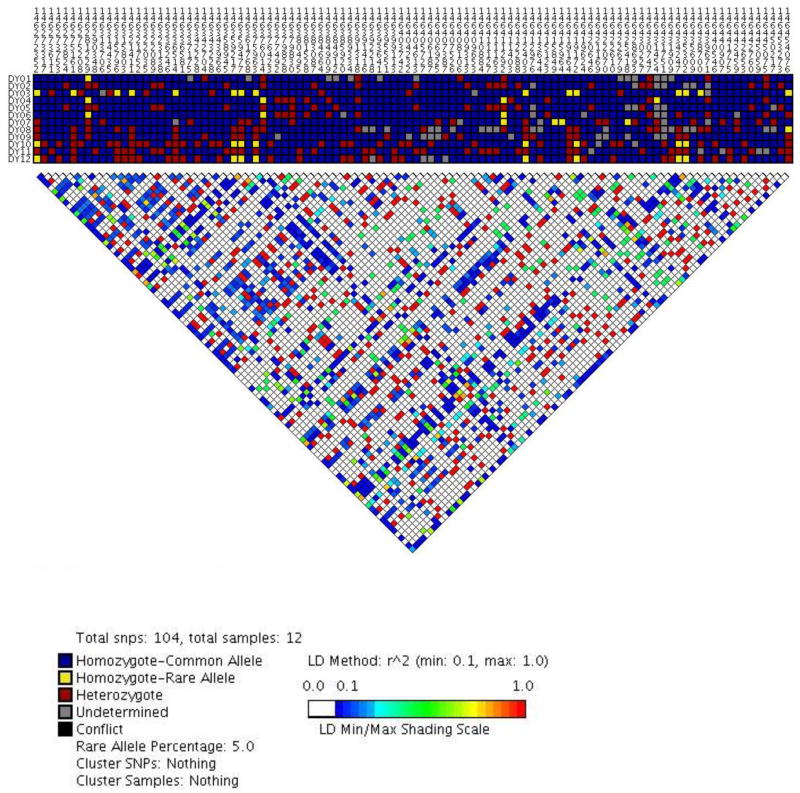
Figure 2. Patterns of linkage disequilibrium (r2) in Yoruban Africans (n=12) across ANAPC10, ABCE1, and OTUD4.
Common SNPs (minor allele frequency >5%) are numbered across the top of the figure, and samples are numbered to the left side of the figure. SNPs are numbered according to their chromosomal position based on NCBI Build 36. Each square represents the individual’s genotype for a specific SNP, and each square is color-coded so that blue represents homozygosity for the common allele, red represents heterozygosity, and yellow represents being homozygosity for the rare allele. Gray represents missing data.

