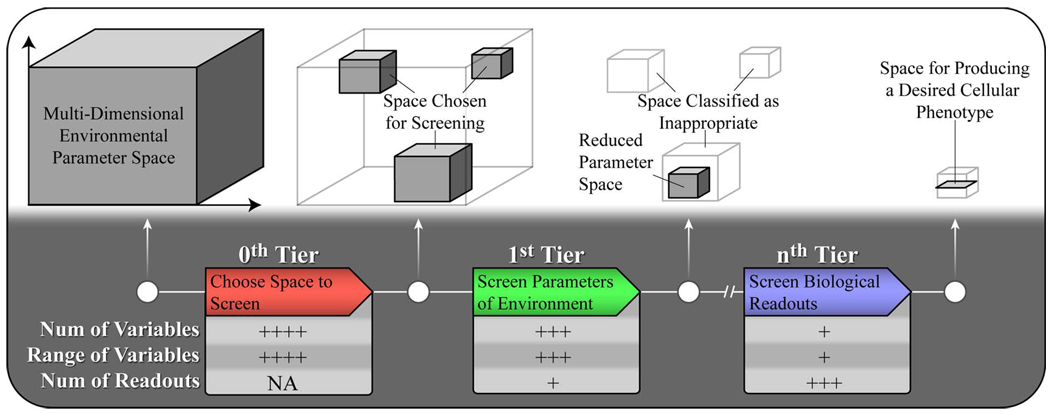
Fig. 3.
Multitiered approach to screening the microenvironment. The bottom half of the figure describes the process of screening and filtering environmental parameters as one moves to the right. The 0th tier represents the decision process of choosing an initial screening space. The first tier is focused on reducing the large number of environmental variables using only a few biological readouts. The process comes to an end with the nth tier, which in this case is meant to represent the last tier in a screen for phenotype. In the nth tier the original screening space has been filtered to a small sub space that is examined using a diverse set of biological readouts to thoroughly characterize the model phenotype. The upper half illustrates visually the reduction of the environmental screening space throughout this process. Similar to drug discovery, it is hoped that the attrition rate of screening space reduces with each tier to maximize the benefits of a multitiered design and mitigate the loss of important variables.

