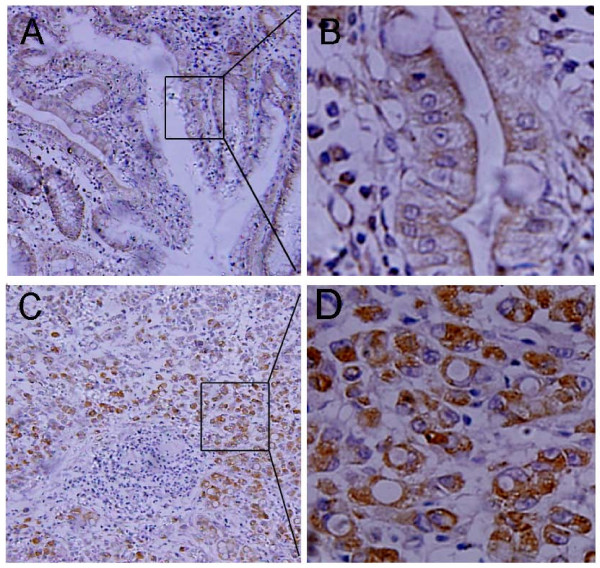
Figure 3.
DNMT3A expression in gastric cancerous and corresponding paracancerous tissues. DNMT3A is shown as brown and is well distributed in the cytoplasm. (A, B) Immunohistochemical staining of DNMT3A in paracancerous tissues of GCs (A, ×100 and B, ×400). (C, D) Immunohistochemical staining of DNMT3A in cancerous tissues of gastric cancer cases (C, ×100; D ×400).

