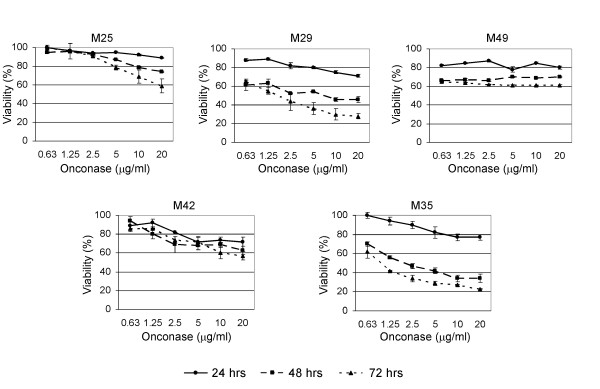
Figure 1.
Human MM cells exhibit different sensitivities to Onconase. M25, M29, M35, M42, and M49 cells were plated at ~50% confluence, treated with the indicated concentrations of Onconase and evaluated for cell viability by MTS assay at 0, 24, 48 and 72 h following treatment. Graphs represent percent viability of Onconase-treated cells compared to corresponding untreated cells. Bars depict standard error among replicate samples within a representative experiment. Results were validated in repeated experiments.

