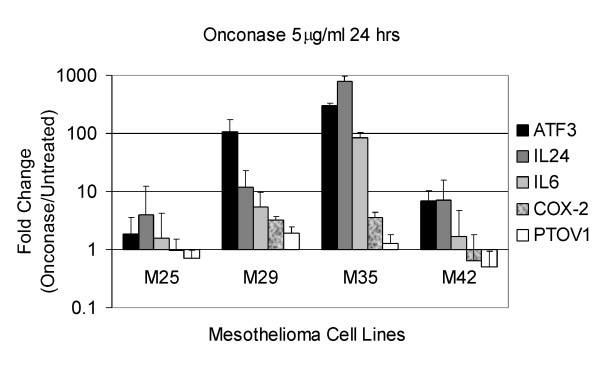
Figure 2.
Quantitative gene expression changes in four human MM cell lines. RT-PCR was performed as described in the Materials and Methods. Error bars represent standard deviation in the expression level of ATF3, IL-24, IL-6, COX-2 and PTOV1 across three independent experiments in MM cells treated with 5 μg/ml Onconase for 24 h.

