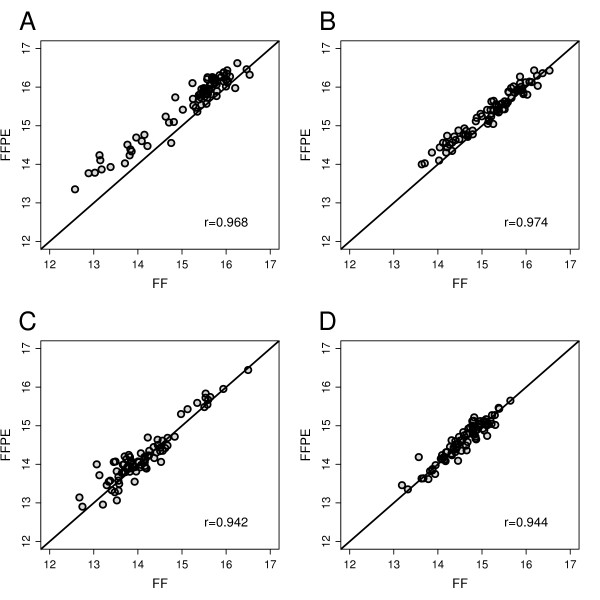
Figure 1.
Comparison of scores computed from intact RNA and partially degraded RNA from FFPE material. Scores were determined for RNA from FF material and RNA from corresponding FFPE tumor material of 82 patients. Scatter plots are shown between scores from FF and FFPE tissues representing ER_8 (A), PGR_5 (B), HER2_2 (C) and PRO_10 (D) for each tumor. Pearson correlations are indicated.

