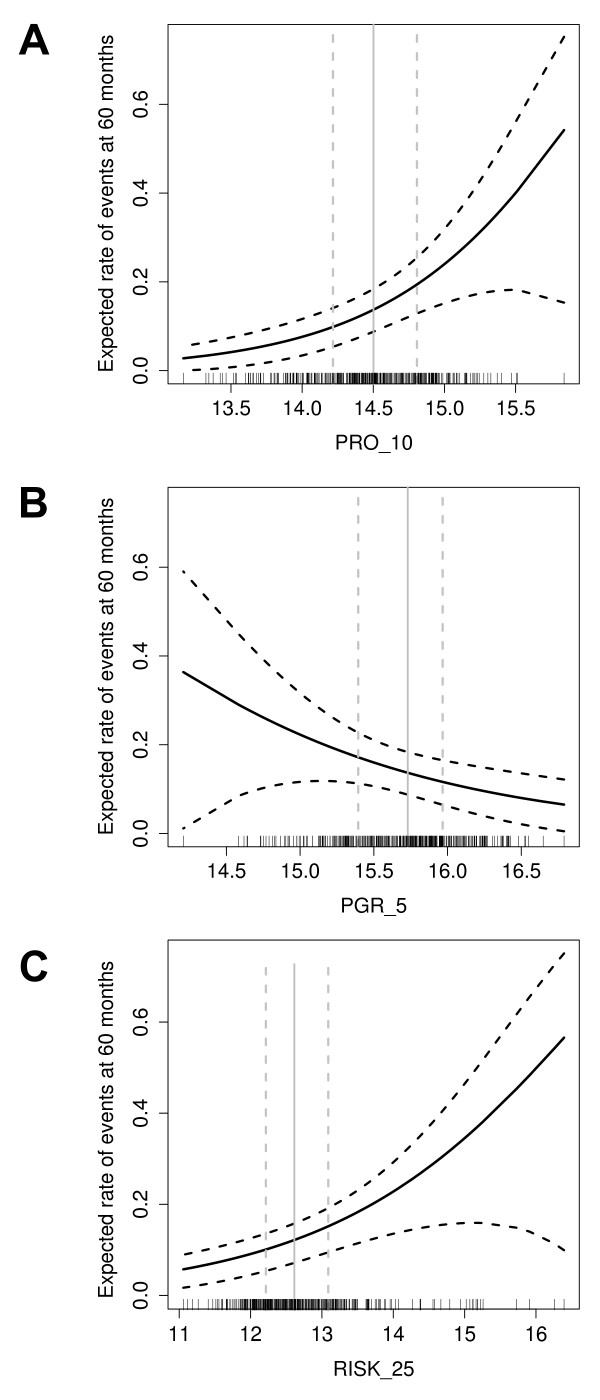
Figure 4.
Expected rate of disease-free survival (DFS). The expected rate of events at 60 months (solid line) is shown as a function of PRO_10 (A), PGR_5 (B) and RISK_25 scores (C). The 95% confidence intervals are indicated (dashed lines). Vertical lines represent the median of all scores (solid line) and 25% and 75% quantiles (dashed lines).

