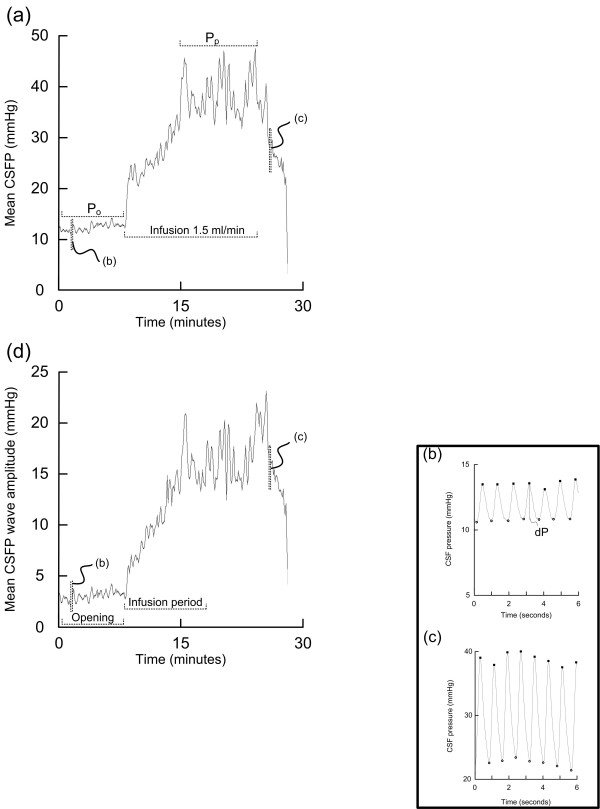
Figure 1.
Analysis of lumbar infusion tests: (a) a plot showing our conventional method of performing a lumbar infusion test, using constant-rate infusion at 1.5 ml/min of Ringer solution. The plot of mean CSFP against time incorporates the period before infusion (opening pressure; Po), and during the infusion period (infusion rate of 1.5 ml/min). The plateau pressure (Pp) is indicated. The resistance to CSF outflow (Rout) is calculated as (Pp - Po)/infusion rate. Two 6 s time windows of the continuous CSFP signal from (b) the start and (c) the termination of the infusion test are indicated, illustrating the single CSFP pulse waves. (d) Plot of mean CSFP pulse amplitude against time, indicating the period after lumbar puncture and before infusion (opening phase), and the 10 min period during the infusion. For comparison between patients we compared the CSFP pulse amplitude during the first 10 min of infusion.

