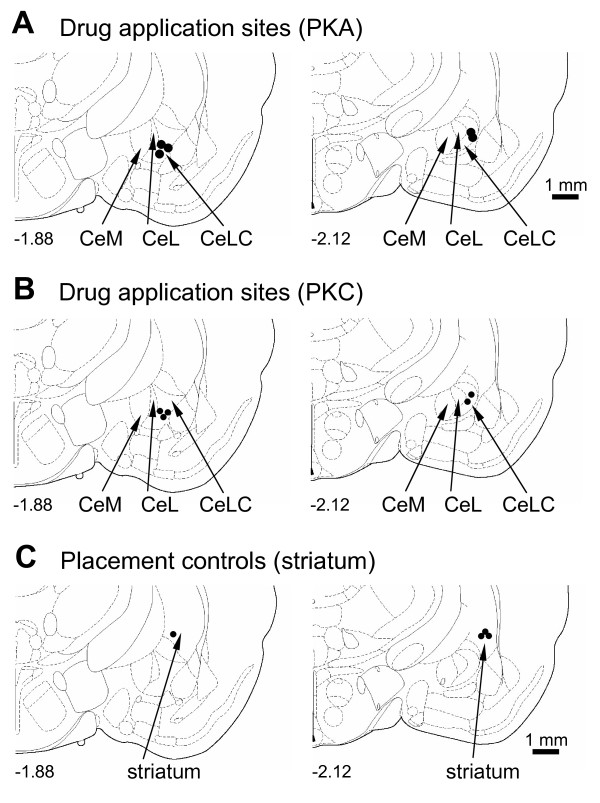
Figure 6.
Histological verification of drug application sites. Diagrams adapted from [49] show coronal sections through the right hemisphere at different levels posterior to bregma (-1.88 and -2.12). Next to each diagram is shown in detail the CeA and its subdivisions, the medial (CeM), lateral (CeL) and latero-capsular (CeLC) part. Each symbol indicates the location of the tip of one microdialysis probe. The boundaries of the different amygdala nuclei are easily identified under the microscope (see Figure 1 in [30]). Calibration bars for diagrams are 1 mm.

