Figure 1.
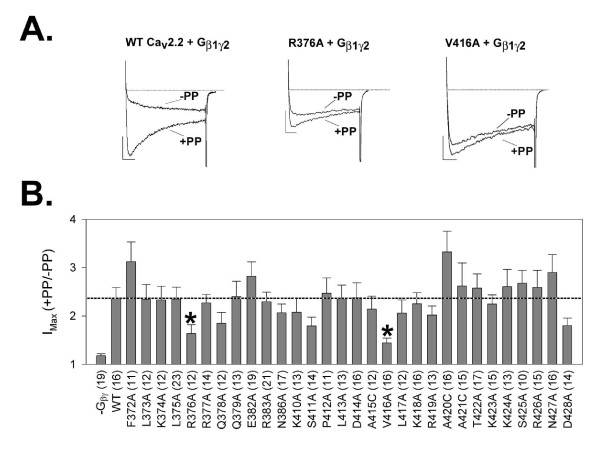
A: Three sets of typical current traces from tsA-201 cells expressing WT or mutant rat Cav2.2 calcium channels and Gβ1γ2, as described in METHODS. Each is a matched set of current traces from sequential test pulses, with the second test pulse preceded by a150-mV depolarizing prepulse. (Vertical and horizontal scale bars represent 15 pA and 15 ms, respectively; in each set the trace with larger current values is from the second test pulse.) Left: traces from a cell expressing the WT channel and Gβ1γ2. Center: traces from a cell coexpressing the Cav2.2-R376A mutant channel and Gβ1γ2. Right: traces from a cell coexpressing the Cav2.2-V416A mutant channel and Gβ1γ2. B: Histogram summarizing the results of paired-pulse facilitation (PPF) experiments performed with all Ala/Cys point mutants of Cav2.2; columns show mean PPF values with SE bars for each condition. Respective positions of mutations in the Cav2.2 amino acid sequence are indicated by numbers beneath the corresponding columns (see METHODS for full description of the mutations used). Of the 30 individual amino acid residues examined in the Cav2.2 I-II linker region, Ala mutations at both Arg376 and Val416 (*p < 0.05, t-test) result in a significant loss of Gβγ-mediated channel inhibition, as measured by the degree of pre-pulse relief following a depolarizing pre-pulse, when compared to WT control. Numbers in parentheses indicate numbers of cells tested.

