Figure 5.
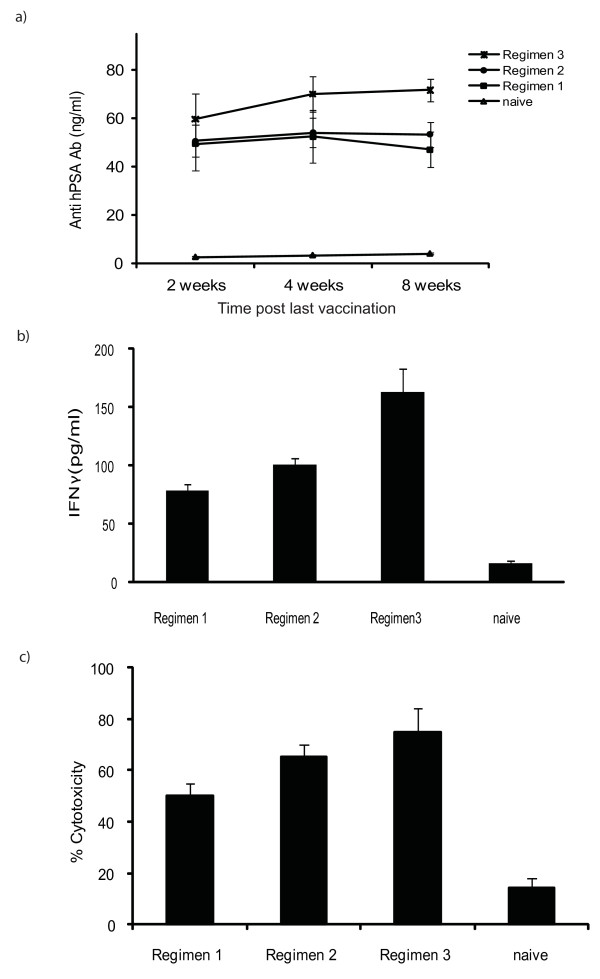
Induction of protective anti-tumour immunity. a) Levels of anti-hPSA antibodies at various time points from both vaccinated and from naive mice. Elevated levels of the anti hPSA antibodies were found in the serum from the immunised mice. Regimen 3 resulted in higher levels at all time points. Errors bars represent SE. b) IFNγ production - at study end point in various groups (n = 6), supernatants from the stimulated (48 hours) splenocytes collected and tested for the production of IFNγ. Higher levels of IFNγ were detected in all groups as compared to naive, while regimen 3 resulted in a much higher IFNγ production (p vs regimen 1 < 0.01, vs regimen 2 = 0.01). Regimen 2 levels were also significantly higher as compared to regimen 1 (p = 0.03). c) In vitro augmentation of the cytolytic activities of the splenocytes after immunisation - specific cytotoxicity was greatest at an effector target ratio of 20:1 in all vaccination schedules. Maximum cytotoxicity was observed in regimen 3. The % cytotoxicity was significantly higher than naive for all regimens, but differences between regimens were not statistically different (p > 0.05) (p vs regimen 3 = 0.02, vs regimen 2 = 0.01, vs regimen 1 = 0.03). Errors bars represent SE.

