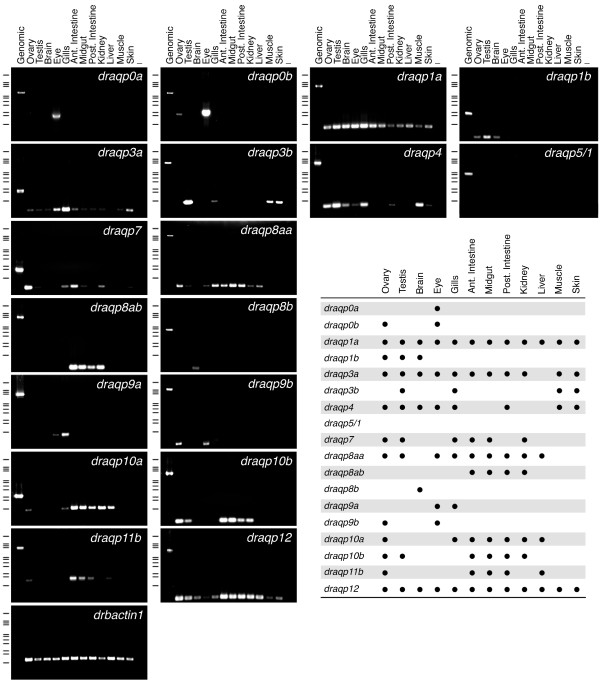
Figure 8.
Aquaporin gene expression in adult tissues of zebrafish. Representative RT-PCR analysis of aquaporin and b-actin1 (drbactin1) transcripts. PCR on genomic DNA was used as control. Minus indicates absence of RT during cDNA synthesis. The size (kb) of PCR products and molecular markers are indicated on the left; from top to bottom: 21.23, 5.15, 4.27, 3.53, 2.03, 1.91, 1.58, 1.37, 0.95, 0.83 and 0.56. A summary of the presence or absence of the aquaporin transcripts in the different tissues is shown to the lower right.

