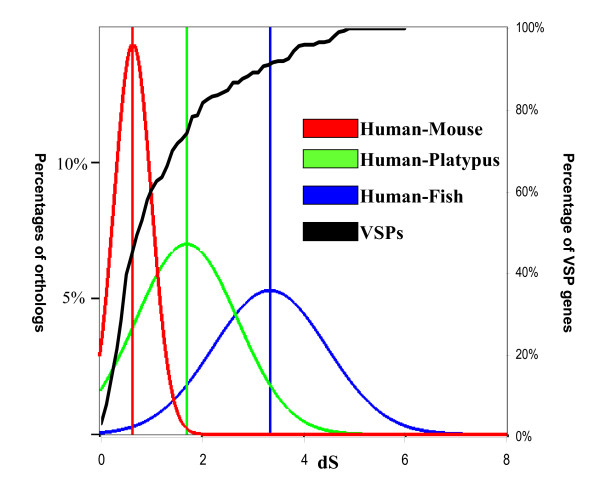
Figure 4.
Comparison of dS for duplicated genes in G. lamblia with orthologs among animals. The red curve represents distribution of dS of orthologs between Human and Mouse; the green curve denotes distribution of dS of orthologs between Human and Platypus; the blue one displays distribution of dS of orthologs between Human and Zebrafish. The black curve is the cumulative distribution of VSP genes in G. lamblia.

