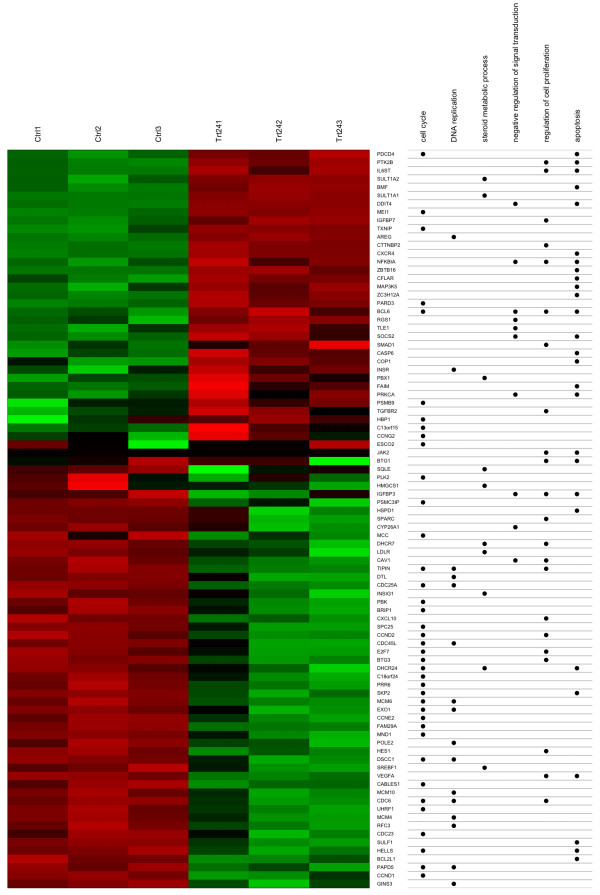
Figure 3.
Concept-and-gene cross tabulations. The left side is a heatmap in which green and red bars represent lower and higher expression based on the gene expression profile, respectively. The right side is the annotation table, which shows the relationship between genes and six relevant GO categories. Ctrl: control; Trt24: treatment after 24 hours.

