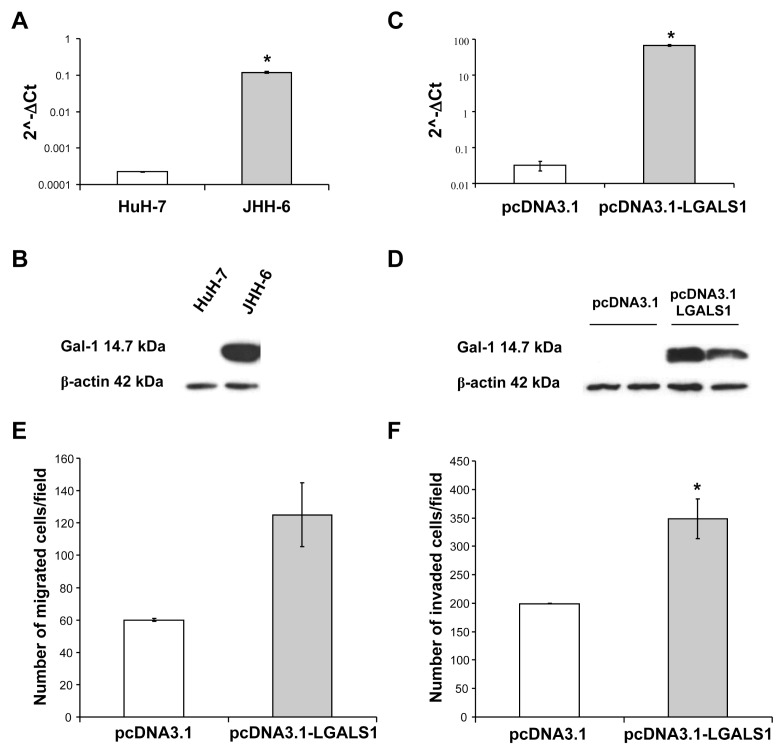
Figure 4.
Effect of Gal-1 on migration and invasion. (A) LGALS1 expression relative to β-actin in HuH-7 and JHH-6 cells. The histograms show the mean values of 2(−ΔCt) in HuH-7 and JHH-6 cells. The error bars in the histogram were determined by SEM of ΔCt values. *P = 0.004, Student t test. (B) Immunoblotting analysis was performed on total protein extracts (30 μg/lane) from HuH-7 and JHH-6 cells. A very high level of Gal-1 expression was observed in more aggressive JHH-6 cells. (C) LGALS1 expression relative to β-actin in HuH-7 cells transfected with plasmid containing LGALS1 cDNA or empty vector. The histograms show the mean values of 2(−ΔCt) in HuH-7 transfected cells. The error bars in the histogram were determined by SEM of ΔCt values. *P = 0.004, Student t test. The graph shows one of three independent experiments with similar results. (D) Immunoblotting analysis was performed on total protein extracts (15 μg/lane) from HuH-7 cells transfected with plasmid containing LGALS1 cDNA or empty vector. The panel shows one of three independent experiments, performed in duplicate, with similar results. (E) Migration assay for the LGALS1-overexpressing HuH-7 cells. The LGALS1 overexpression results in an increase in the average number of HuH-7 migrating cells transfected with plasmid containing LGALS1 cDNA (number of migrated cells/field = 125; SEM = 19.83) compared with the migrating cells transfected with empty vector (control) (number of migrated cells/field = 60; SEM = 0.83). (F) Invasion assay for the LGALS1-overexpressing HuH-7 cells. The LGALS1 overexpression results in a significant increase in the average number of HuH-7 invading cells transfected with plasmid containing LGALS1 cDNA (number of invaded cells/field = 348.42; SEM = 35.08) compared with the invading cells transfected with empty vector (control) (number of invaded cells/field = 199.17; SEM = 0.5). *P = 0.05, Student t test.

