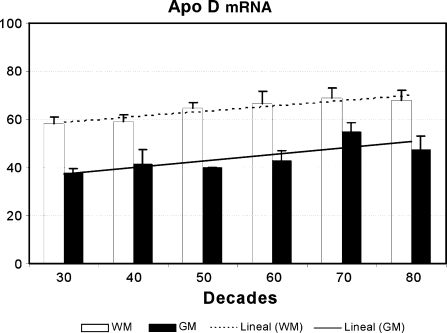
Fig. 5.
Levels of apo D mRNA, in white (WM) and grey matter (GM), in samples from 26 subjects between 32 and 88 years old. The histogram shows the densitometry analysis of slot blots. Data presented as means of relative optical densities with standard error of the mean shown by vertical bars. The lineal correlation with age is also shown (r = 0.555, p < 0.05 for the grey matter and r = 0.518, p < 0.01 for the white matter)

