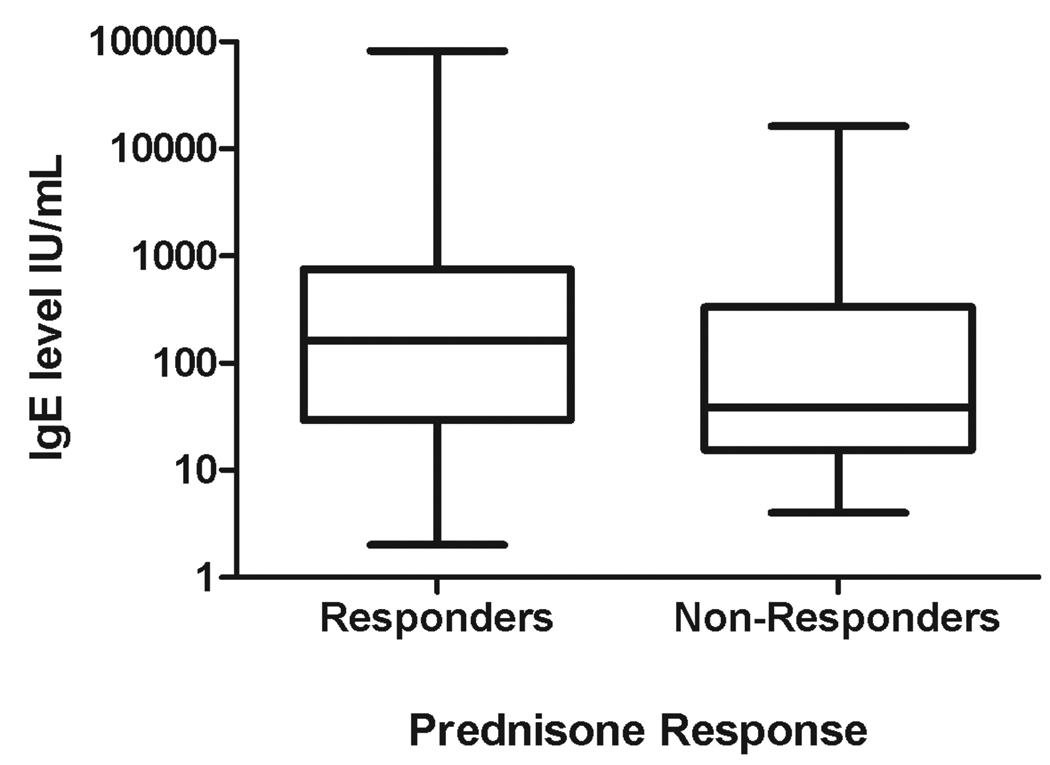
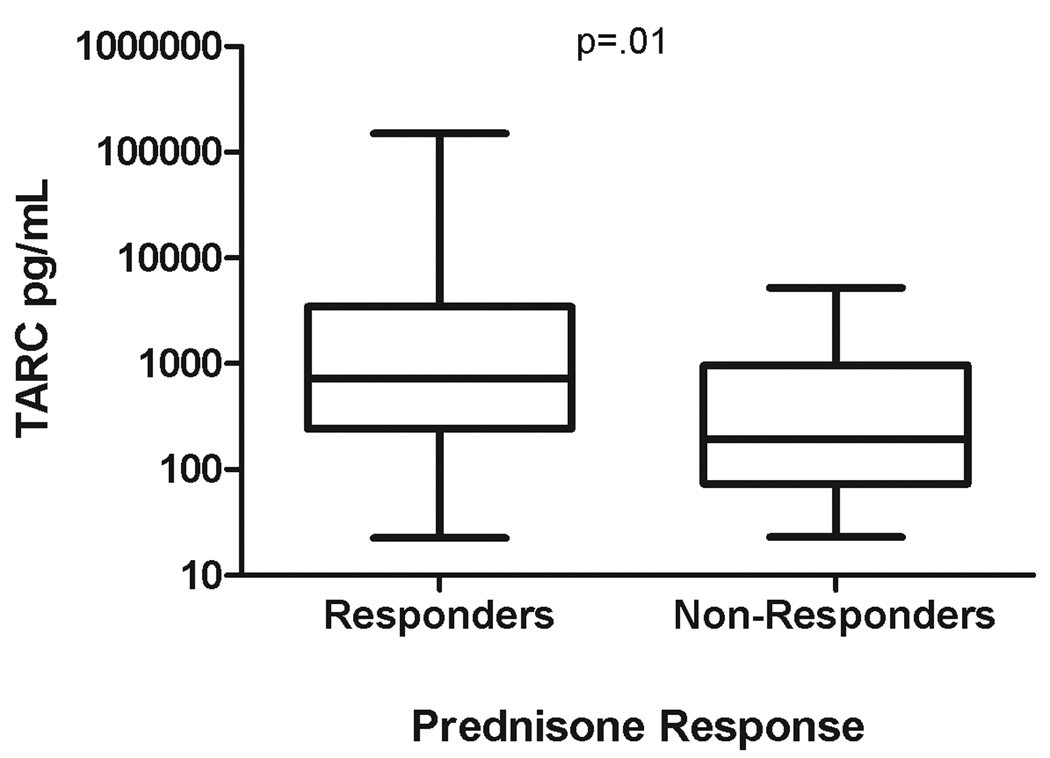
Figure 3.
Association of serum TARC, but not serum IgE levels with prednisone responsiveness. Serum IgE (A) and TARC (B) levels for prednisone responders (n=129 and 75, respectively) and non-responders (n=13 and 8, respectively) are shown using box and whiskers plots. The whiskers represent the minimum and maximum values and the horizontal lines represent the lower quartile, median, and upper quartile.


