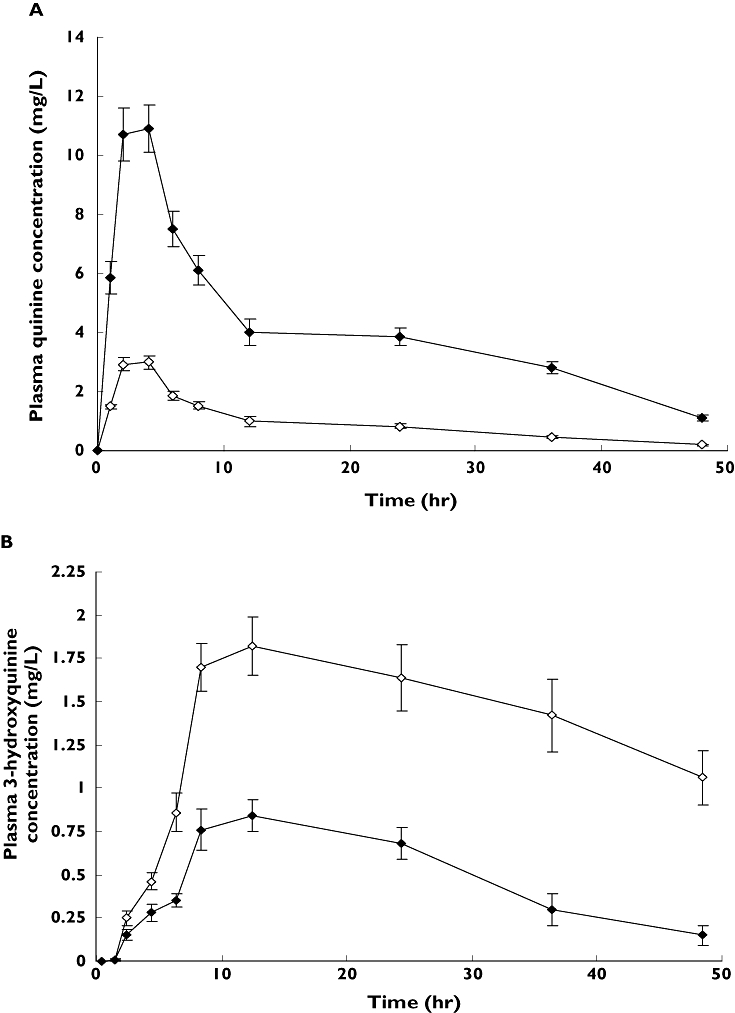
Figure 2.

Mean (±) SD plasma concentration vs. time profiles of quinine (a) and 3-hydroxyquinine (b) following administrations of a single 600-mg oral dose of quinine sulphate with or without concurrent multiple oral doses of ritonavir (200 mg 12 hourly for 9 days) to each of 10 healthy volunteers. The quinine dose was co-administered with the 15th dose (day 8) of ritonavir. (A) Quinine alone ( ); Quinine with Ritonavir (
 ); (B) 3-hydroxyquinine alone (
 ); 3-hydroxyquinine in presence of ritonavir (
 )
)
