
Figure 3.
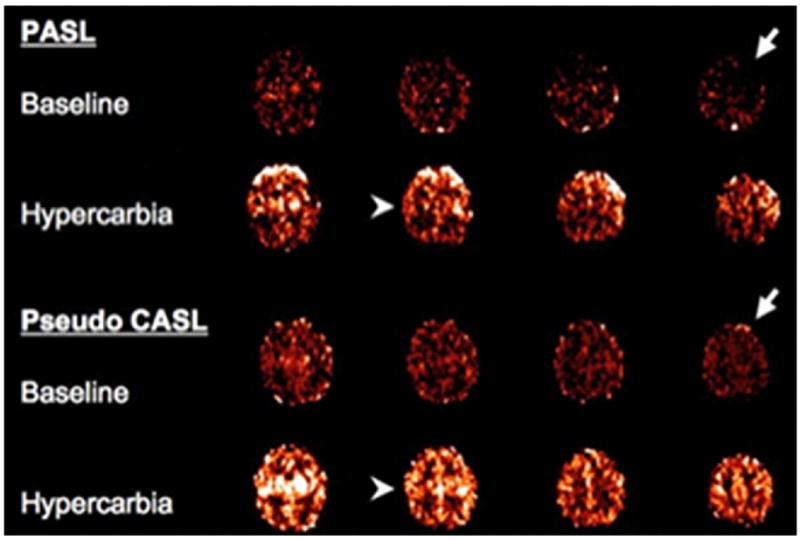
A direct comparison of PASL (upper) and pseudo CASL (lower). Images were obtained sequentially in a single patient both at rest (baseline) and hypercarbia. The 2 right arrows demonstrate increased negative pixels on PASL imaging in the left frontal cortex. The arrowheads on the left demonstrate improved anatomic resolution in the central sulcus. (Color version of figure is available online.)