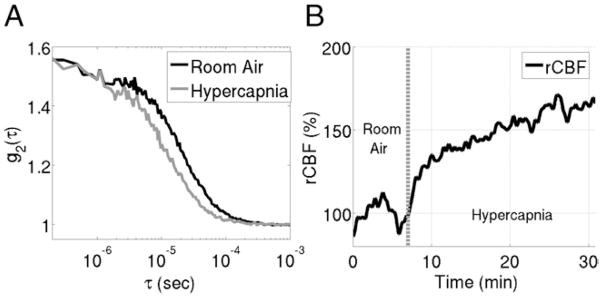
Figure 9.
(A) sample autocorrelation curve measured with diffuse correlation spectroscopy on a neonate with hypoplastic left heart syndrome. The “baseline” curve, taken on the patient’s forehead during room air inhalation, decays slower than the hypercapnia curve taken while the patient inhaled a CO2 gas mixture. The increase in the decay rate during hypercapnia indicates an increase in CBF compared with the resting baseline period. (B) Trace of relative change in cerebral blood flow (rCBF) during this hypercapnia experiment extracted from autocorrelation curves measured every 3 seconds.

