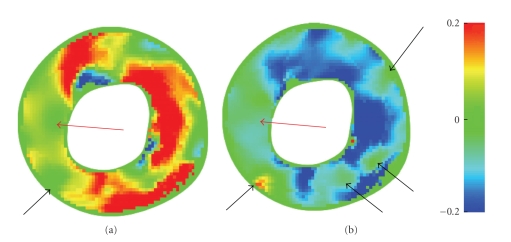
Figure 4.
Radial (a) and circumferential (b) colour-coded strains in a basal short-axis slice at approximately end-systole for a patient. Red arrows on the left indicate regions where the respective strain values deviate from normal. These regions were confirmed to be static by a cardiologist. The patient's anamnesis mentions small infarcts on either side of these regions. Their locations, indicated by black arrows, are highlighted in late-enhancement MRI.

