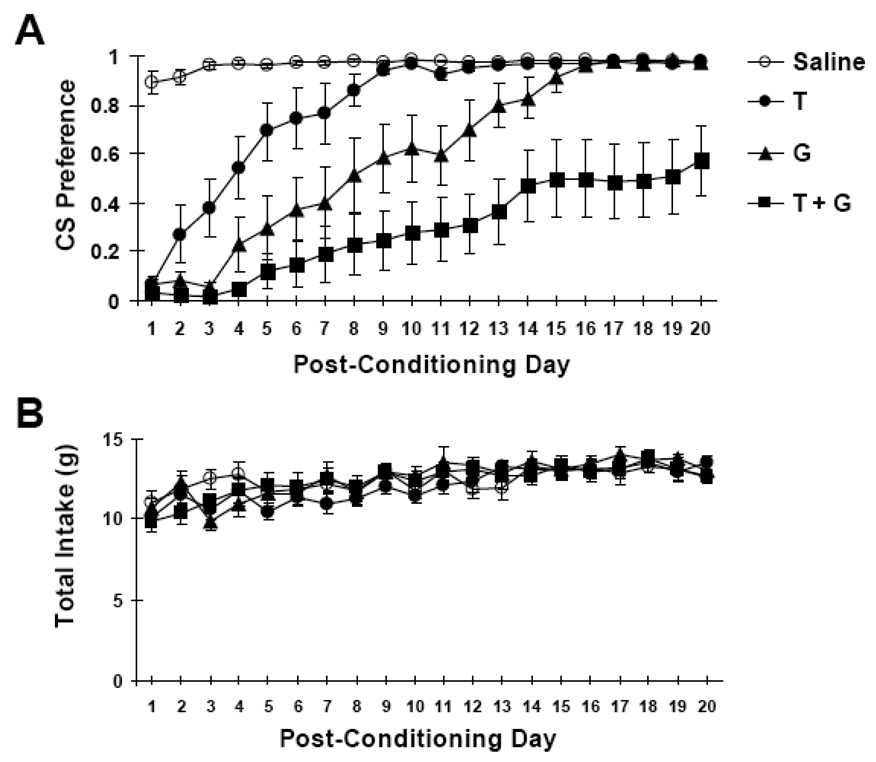
Figure 7.
A. Mean (± SE) preference scores for CS vs. warm water in 10-min, 2-bottle tests after 4 treatments: 10°C sucrose paired with saline injection (white circles); 10°C water paired with LiCl injection ("T", black circles); 25°C sucrose paired with LiCl ("G", black triangles); and 10°C sucrose paired with LiCl ("T+G", black squares). B. Mean total intake of all groups across the post-conditioning period.

