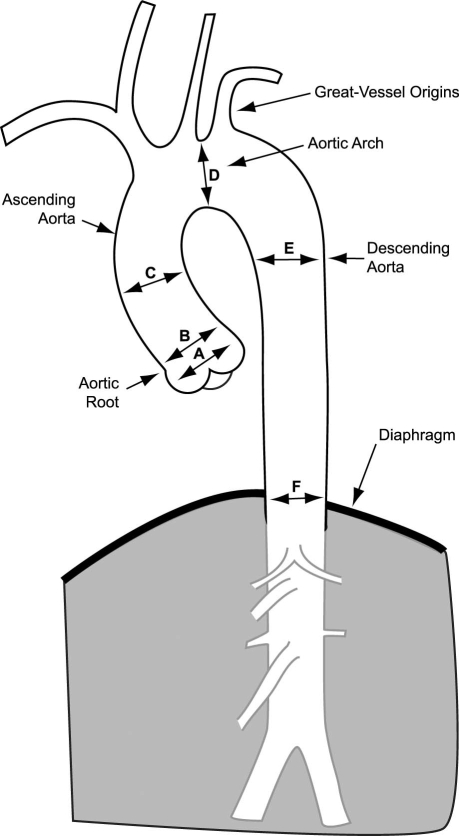
Fig. 1 This diagram of the thoracic aorta demonstrates the segments used for the evaluation of image quality and the levels used for the measurement of aortic dimensions, including the sinus of Valsalva (A), sinotubular junction (B), mid-ascending aorta (C), mid-aortic arch (D), mid-descending aorta (E), and diaphragm level (F).

An official website of the United States government
Here's how you know
Official websites use .gov
A
.gov website belongs to an official
government organization in the United States.
Secure .gov websites use HTTPS
A lock (
) or https:// means you've safely
connected to the .gov website. Share sensitive
information only on official, secure websites.
