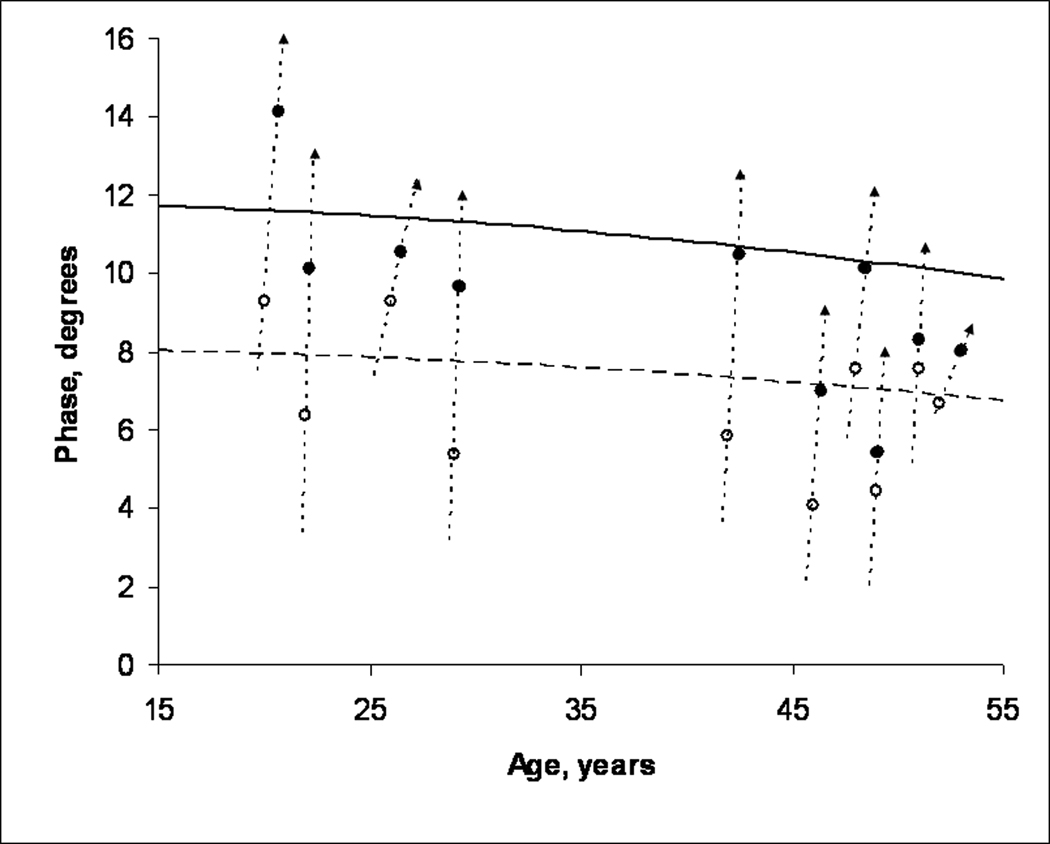
Figure 3.
The age-dependent mean value for 50 kHz θ for tibialis anterior is shown in the upper, solid curve, while the 95% lower confidence limit of normal is shown in the lower, dashed curve. For each patient, θ was measured in tibialis anterior at the time of cast removal (open circle) and then after mobility had been restored for several weeks to months (filled circle). In all 10 cases, an increase was noted between the two data points. In six cases, the initial measurement was smaller than the lower limit of normal. After mobility was restored, θ returned to a normal value in 4 of these cases and to near normal in a fifth.

