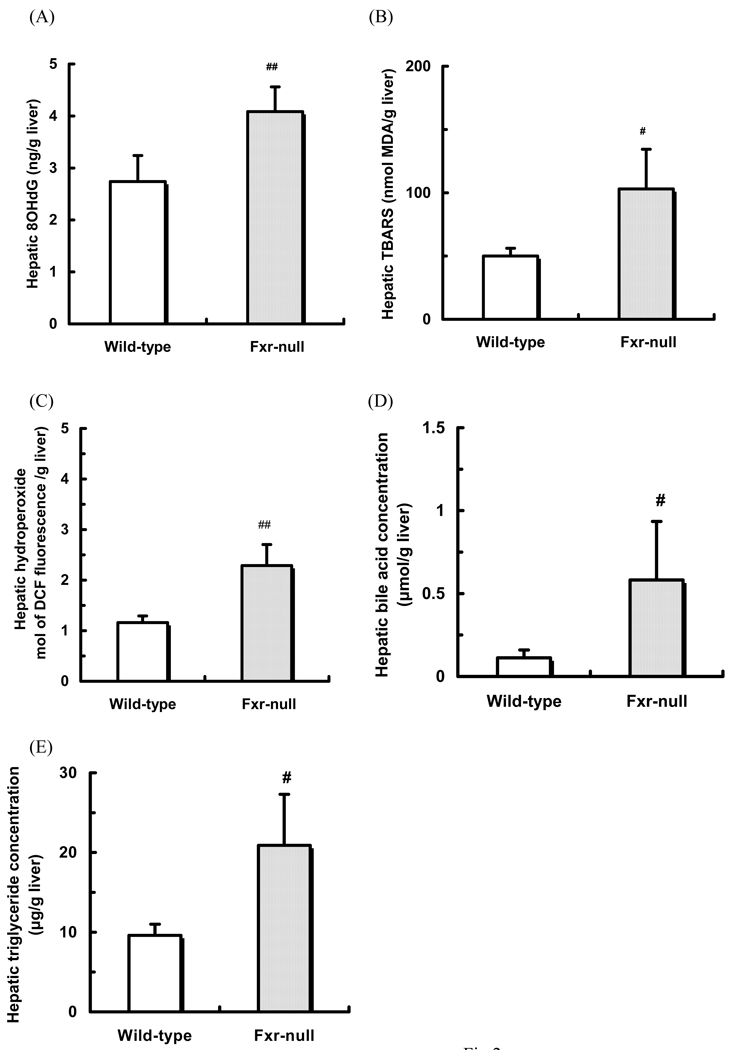
Fig. 2.
Hepatic 8OHdG (A), TBARS (B), hydroperoxide (C), bile acid (D) and triglyceride (E) concentrations
Hepatic 8OHdG concentrations were measured by ELISA. Hepatic TBARS, bile acid and triglyceride concentrations were measured by enzyme-colorimetric method. Hepatic hydroperoxide concentrations were measured as fluorescence of dichlorofluorescein.
Data are shown as mean ± S.D. (n=8). #, ##: significantly different from CA group (p<0.05, p<0.01, respectively)

