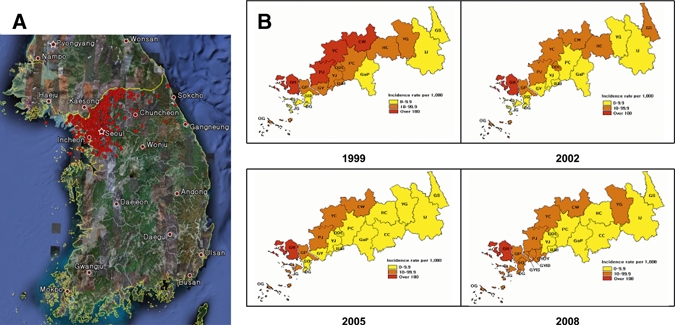
Figure 1.

High-risk areas for malaria in Republic of Korea in 1999, 2002, 2005, and 2008. A, Spot map of the occurrence of Plasmodium vivax malaria. Active local transmission may occur near the Demilitarized Zone (DNZ). South Korea and North Korea are separated by the yellow national boundary line with the DMZ adjacent to the line. B, Major risk area of P. vivax malaria in South Korea. Results are plotted in yellow, orange, and red, which represent < 10.0, 10.1–99.9, and > 100.0 patients/1,000 population, respectively. The subsets by year (1999, 2000, 2005, and 2008) represent 23 high-risk areas in South Korea that showed epidemiological changes. GH = Ganghwa-gun; DG = Dong-gu; SG = Seo-gu; OG = Ongjin-gun; JG = Jung-gu, Gyeonggi-do Province; GaP = Gapyeong-gun; GY = Goyang-si; GYDY = Goyang-si Deogyang-gu; GYID = Goyang-si Ilsan-Donggu; GYIS = Goyang-si Ilsan-Seogu; GIP = Gimpo-si; DDC = Dongducheon-si; YJ = Yangju-gun; YC = Yeoncheon-gun; UJB = Uijeongbu-si; PC = Pocheon-gun; PJ = Paju-si, Gangwon-do Province; GS = Goseong-gun; YG = Yanggu-gun; IJ = Inje-gun; CW = Cheorwon-gun; CC = Chuncheon-si; HC = Hwacheon-gun.
