
Figure 2.
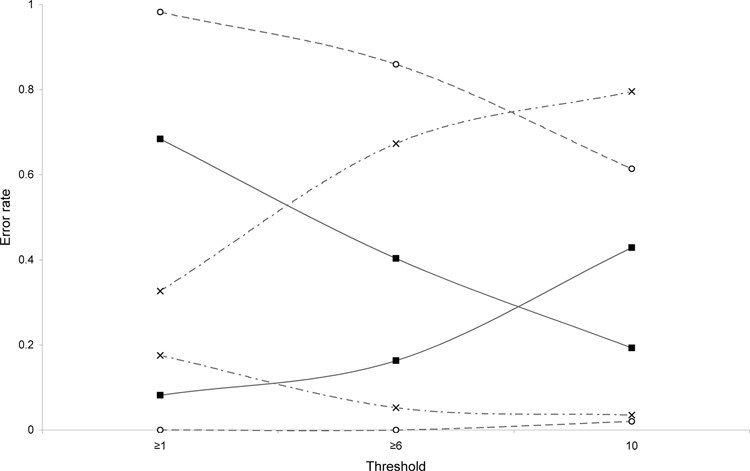
Evaluation of omission and commission error rates for three different models. Graph shows omission (false negatives) and commission (false positives) error rates for three models based on 7 high-incidence villages (crosses), 20 moderate-to-high villages (black squares), and 48 low-to-high incidence villages (open circles) evaluated under three different thresholds: ≥ 1 of 10 best subset models predicting presence, ≥ 6 of 10 best subset models predicting presence, and 10 of 10 best subset models predicting presence.