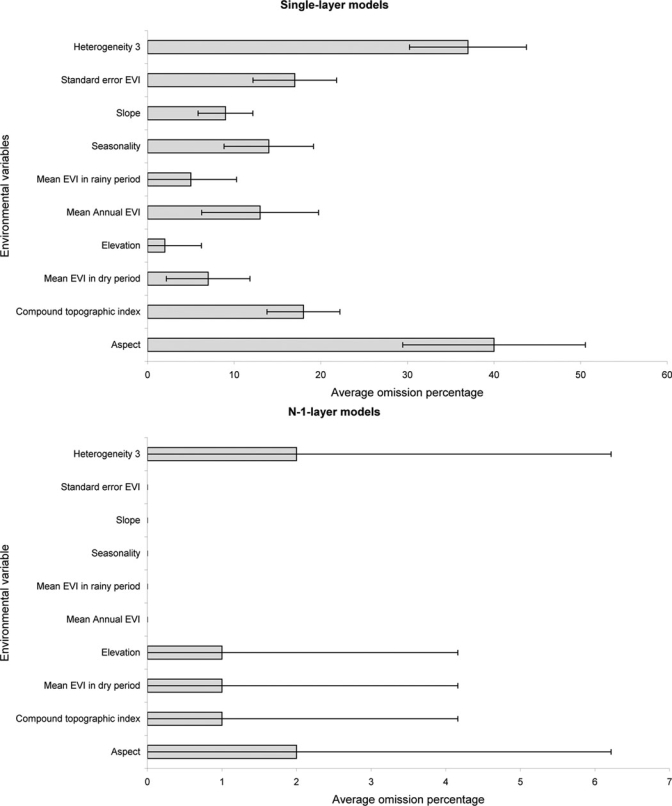
Figure 3.

Relative contributions of environmental variables. Summary of results of single-layer (upper graph) and N-1-layer (lower graph) model analyses indicating mean omission percentages (and standard deviations) calculated based on predictions of 10 best subset models and independent testing points. Note that in single-layer models (upper graph), a positive contribution by a variable is indicated by low values, whereas in N-1-layer models, a positive contribution by a variable is indicated by a high value.
