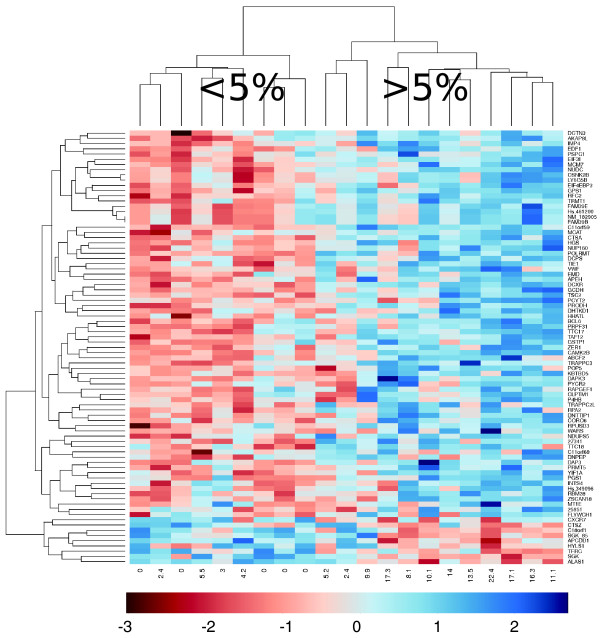
Figure 1.
Cluster analysis identifies high and low weight loss groups. Using SAM and limma, 83 genes were identified as correlating with weight loss. Expression data from these genes were used to drive cluster analysis. This revealed two clusters of subjects; high weight loss (≥ 5%) and low weight loss (<5%).

