Figure 1.
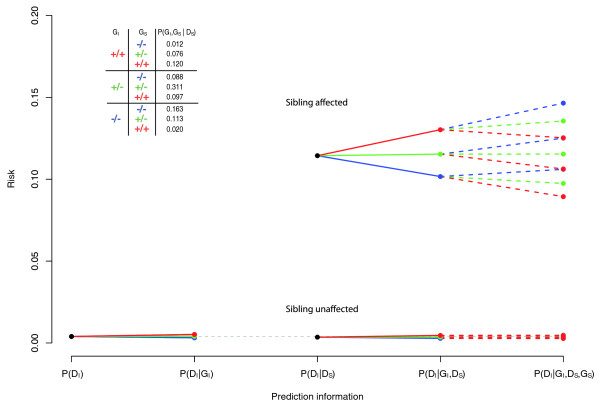
Predicted index disease risk. Predicted index disease risks from a single locus (MAF = 0.425, GRR = 1.25): unconditonal, P(DI); conditional on index genotype, P(DI|GI); conditional on affected sibling phenotype, P(DI|DS); conditional on index genotype and affected sibling phenotype, P(DI|GI, DS); conditional on index and sibling genotypes and affected sibling phenotype, P(DI|GI, GS, DS). The inserted table contains frequencies of sibling pair genotype combinations conditional on at least one sibling being affected. Red represents the homozygous risk-increasing genotype; green the heterozygous genotype; blue the homozygous risk-decreasing genotype.

