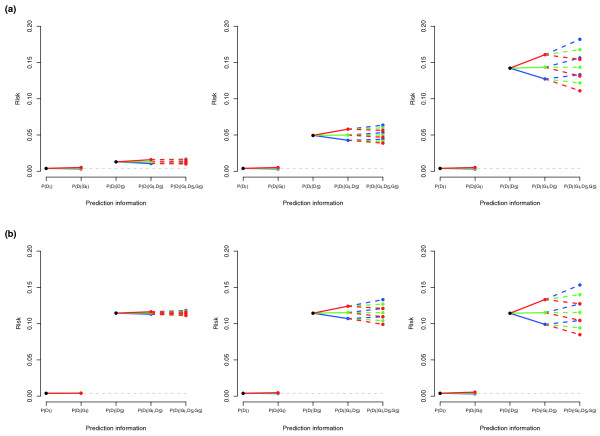
Figure 2.
Predicted index disease risks from a single locus, under a variety of genetic models. Predicted index disease risk stratified by (a) effect size and (b) total sibling relative risk. See Figure 1 legend for details. In all cases, risk allele frequency is 0.425, disease prevalence is 1/250. (a) Varying the familial variance component of the residual variance from 20%, 50% to 80%, with corresponding sibling relative risks of 3.25, 12.25 and 35.5. (b) Varying additive genetic effect from a = 0.01, a = 0.05 to a = 0.1, with corresponding genotypic relative risks of 1.03, 1.16 and 1.30.

