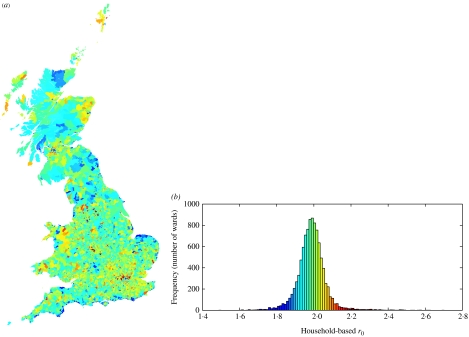
Fig. 2.
Distribution of r0 values in Great Britain, highlighting the predicted variation in early epidemic growth rates. (a) Wards are shown in their geographic locations and coloured according to their r0 value. The histograms in (b) utilize the same colour scale and hence provide a reference for the ward-based map. (Electronic information on ward boundaries is census output, which is Crown copyright and is reproduced with the permission of the Controller of HMSO and the Queen's Printer for Scotland. Source: 2001 Census, Output Area Boundaries [28, 29]. Crown copyright 2003.)

