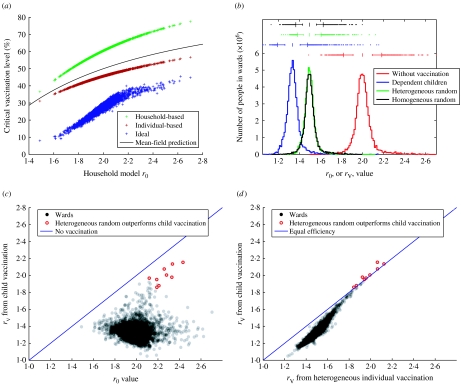
Fig. 3.
Effects of vaccination. (a) Critical levels of vaccine coverage needed to prevent the spread of infection within a ward are shown for three strategies, along with the prediction from standard models in which there is no population structure. (b) The effects on the distribution of ward rV values of three vaccination strategies. These distributions are calculated at individual level since ward-level results are slightly biased by the trend for less populated wards to have smaller household sizes. The box-whisker plots show the mean, 1 and 2 standard deviations and outliers. (c) The ward-level effects of vaccinating dependent children. (d) Comparison of the ward-level effects of vaccinating dependent children and heterogeneous random vaccination, in which the same proportion of each ward is vaccinated. The nine exceptional wards in which heterogeneous random vaccination outperforms vaccinating dependent children are highlighted (red circles) in plots (c) and (d).

