
Figure 6.
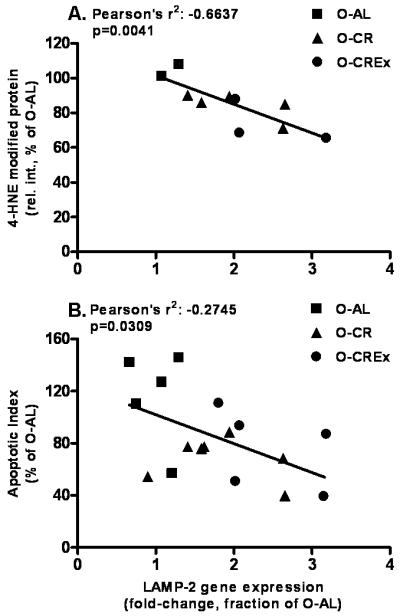
Linear regression analyses between LAMP-2 gene expression (fold-change as fraction of O-AL) and 4-HNE-modified mitochondrial proteins (A), and the apoptotic index (B), respectively. Only data obtained from old animals were included in the regression analysis. Pearson’s r2 and p-values are displayed in the graphs.