
Figure 2.
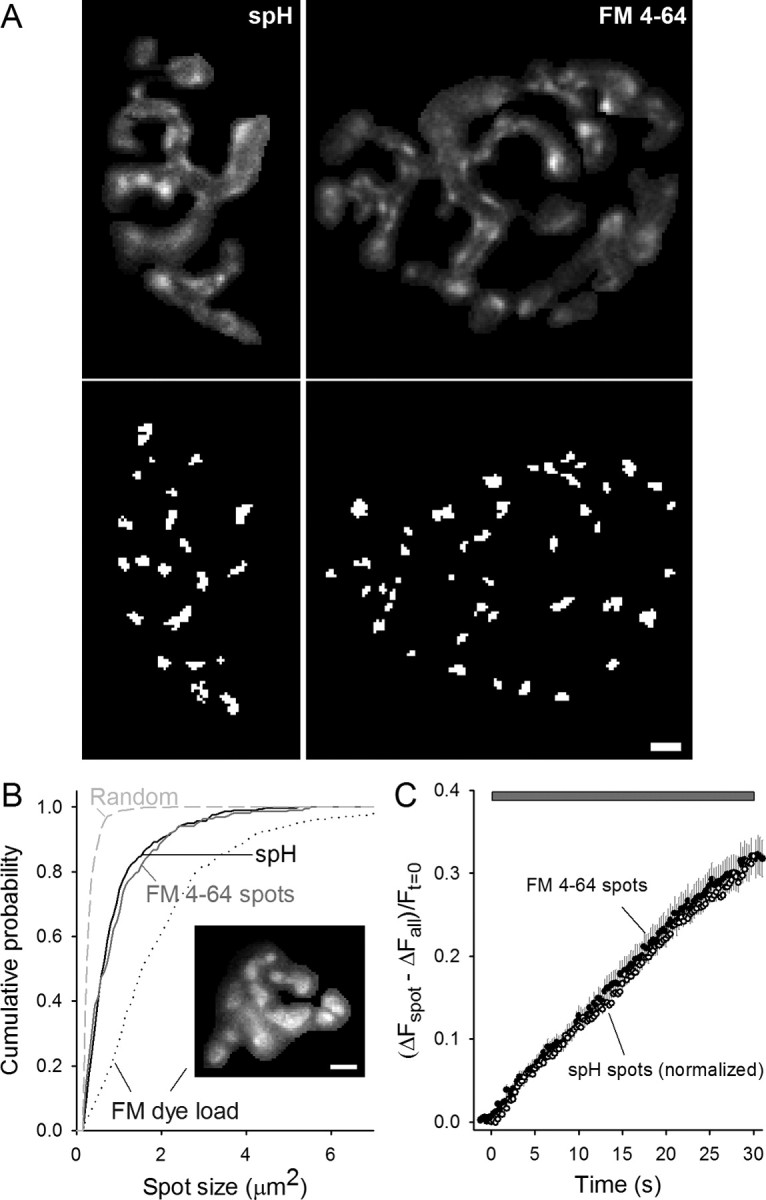
FM4-64 spots and spH spots have similar properties. A, Top, Typical difference in spH or FM4-64 fluorescence intensity after a 30 s, 100 Hz stimulation (different preparations). Bottom, Spots identified in the top images by the automatic spot-finding program (see Materials and Methods). Scale bar, 3 μm. B, Cumulative probability plot of spH spot sizes (solid black line) and FM4-64 spot sizes (solid gray line). For comparison to the overall synaptic vesicle population, the synaptic vesicle distribution was assessed after loading with FM dye (dotted line). Inset, A typical FM dye-loaded terminal. The average spot sizes were 0.92 ± 0.05, 0.98 ± 0.06, and 2.07 ± 1.10 μm2 for spH spots, FM4-64 spots, and FM dye load, respectively. The dashed line represents the spot size distribution after randomly mixing terminal pixel locations. Data are averaged from 298 spH spots, 220 FM4-64 spots, and 466 FM dye load spots. Scale bar, 3 μm. C, Same plot as Figure 1C with the rise in FM4-64 spot fluorescence shown (filled circles). For comparison, peak spH spot fluorescence was normalized to match the peak FM4-64 spot fluorescence and plotted (open circles). The mean time to half maximum was 14.5 ± 1.3 s and 13.3 ± 0.6 s for spH and FM4-64 spots, respectively (p = 0.38, Student's t test). The gray bar indicates 100 Hz stimulation.