
Figure 3.
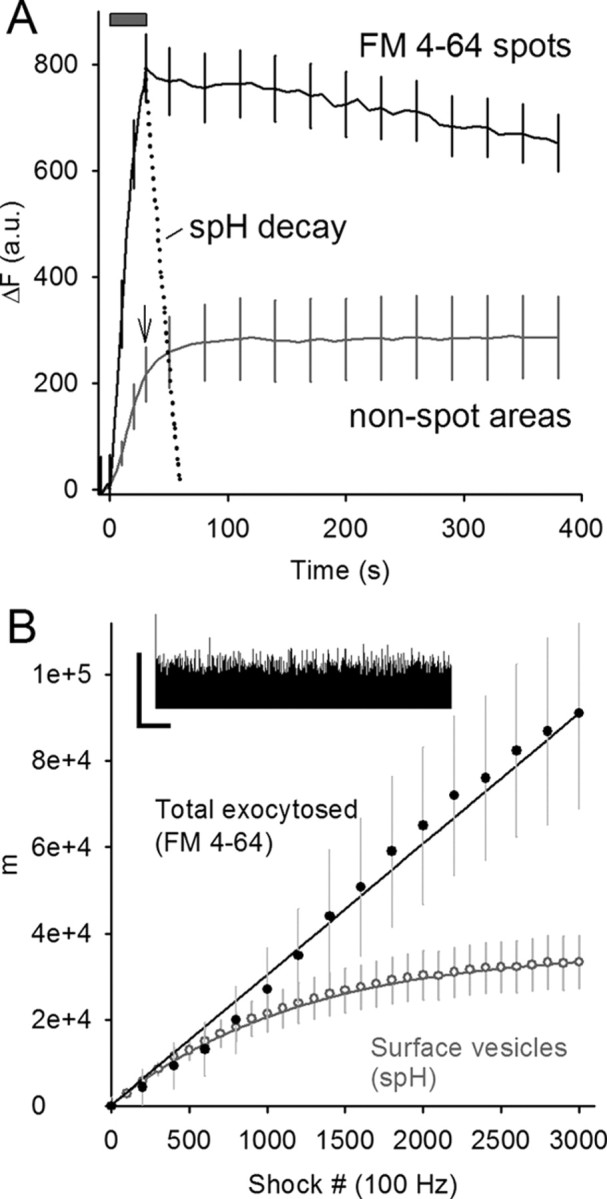
FM4-64 spots persist well after spH endocytosis and reacidification. A, Raw change in fluorescence (in arbitrary units) is plotted versus time for either FM4-64 spots (black line) or nonspot areas of the terminal (gray line; arrow marks end of stimulus train). Fluorescence in the FM4-64 spots dispersed slowly after stimulation (train duration indicated by gray bar), particularly when compared with the time course of synaptic vesicle endocytosis and reacidification (spH fluorescence, dotted line). Fluorescence in FM4-64 spots was estimated to match nonspot area fluorescence ∼17 min after stimulation. Data are averaged from five different terminals. For clarity, error bars are shown for every fifth data point. B, spH labels 35% of the vesicles labeled by FM4-64 at the end of 100 Hz stimulation. Inset, Electrophysiological recording of EPPs during 100 Hz stimulation. The vertical calibration bar indicates the peak amplitude of the first EPP, and the horizontal calibration bar indicates 2 s. Main plot, Quanta (m) are plotted versus shock number. The upper solid line indicates the summed quantal release from EPPs. The lower line indicates the “surface vesicles” or those expected to be visible with spH fluorescence based on a simple model using the spH recovery time constant (see Materials and Methods). Actual FM4-64 fluorescence was scaled to match EPP data (filled circles). The gray circles show the average spH fluorescence rise during stimulation after scaling to the theoretical surface vesicle number (lower solid line).