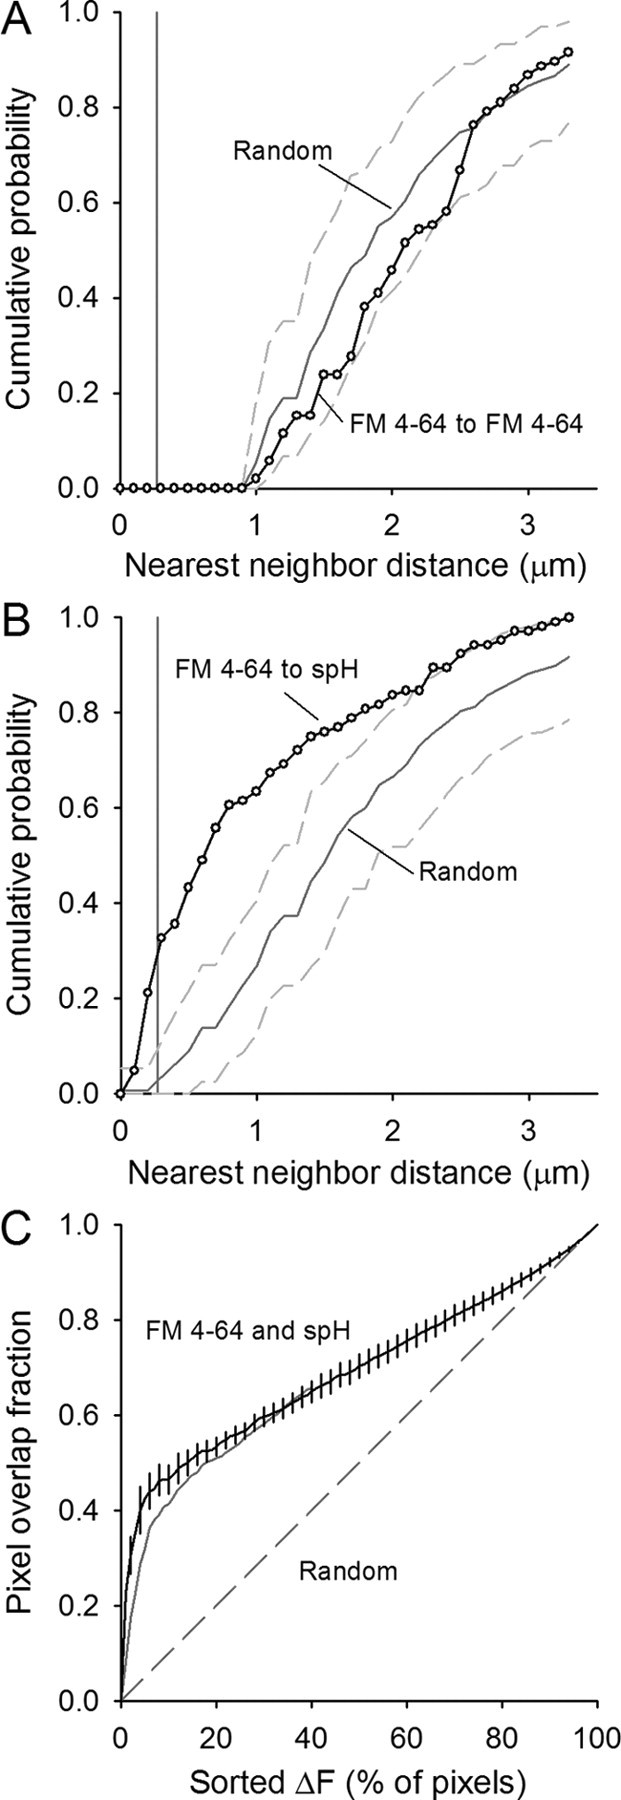
Figure 5.

Quantification of spH and FM4-64 spot overlap. A, Cumulative probability plot of the nearest-neighbor distances for FM4-64 spots visible after a 30 s, 100 Hz stimulation (open circles). The automatic spot detection prevents any two similar spot types from existing within ∼1 μm of each other (pixel size = 270 nm, vertical gray line). Spots placed randomly in the terminal (1000 iterations) have an average distribution indicated by the solid gray line with 95% of all random trials falling between the dashed gray lines. Data represent 105 spots from five different terminals. B, Cumulative probability plot of the nearest-neighbor distances for FM4-64 spots to spH spots (open circles). Spots centered within one pixel distance lie to the left of the vertical gray line (270 nm). Spots placed randomly in the terminal 1000 times have an average distribution indicated by the dark gray line with 95% of all random trials falling within the dashed gray lines. C, For each fluorescent label, the total fluorescence change in each pixel was determined, then pixels were sorted based on their relative fluorescence changes during the 30 s, 100 Hz train. The x-axis shows the percentage of those sorted pixels (for example, 10% represents the 10% of all terminal pixels with the largest fluorescence change during stimulation). The overlap in pixel locations for spH and FM4-64 fluorescence is plotted from 0% to 100% (black line with error bars). Overlap is considerably more than by random chance (dashed line). Some of the overlap is lost if the FM4-64 channel is shifted by one pixel in both the x and y directions (solid gray line), suggesting that the original alignment between the two channels was optimal.
