
Figure 7.
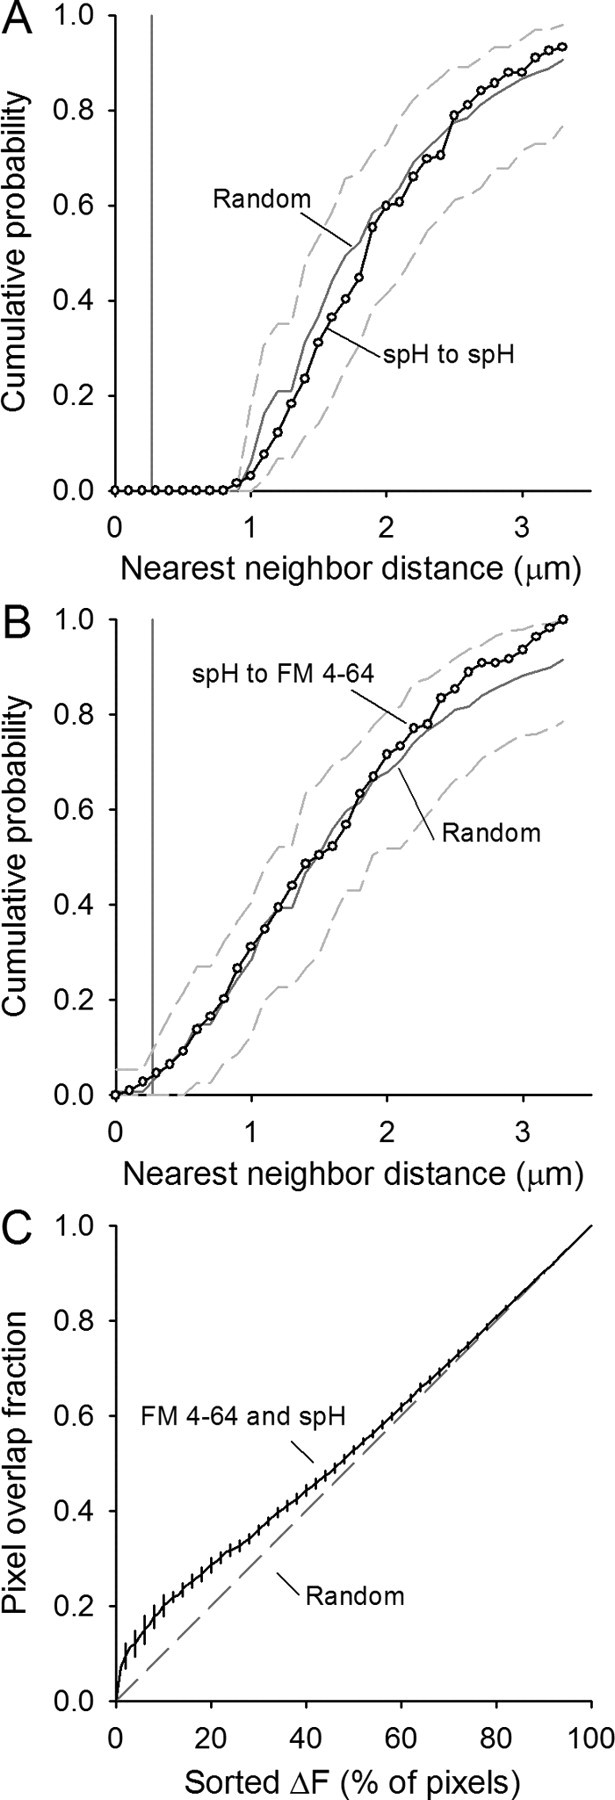
Quantification of spH and FM4-64 spot overlap after moderate stimulation. Plots similar to Figure 5. A, Cumulative probability plot of the nearest-neighbor distances for spH spots identified after a 30 s, 40 Hz stimulation (open circles). Data represent 132 spots from four different terminals. Spots placed randomly in the terminal 1000 times have an average distribution indicated by the dark gray line with 95% of all random trials falling within the dashed gray lines. Pixel size is indicated by the vertical gray line. B, Cumulative probability plot of the nearest-neighbor distances for spH spots to FM4-64 spots (open circles). Spots placed randomly in the terminal 1000 times have an average distribution indicated by the dark gray line with 95% of all random trials falling within the dashed gray lines. Pixel size is indicated by the vertical gray line. C, The overlap in sorted pixel locations for spH and FM4-64 fluorescence is plotted from 0% to 100% of the pixels (black line with error bars). Overlap is only modestly more than expected by random chance (dashed gray line).