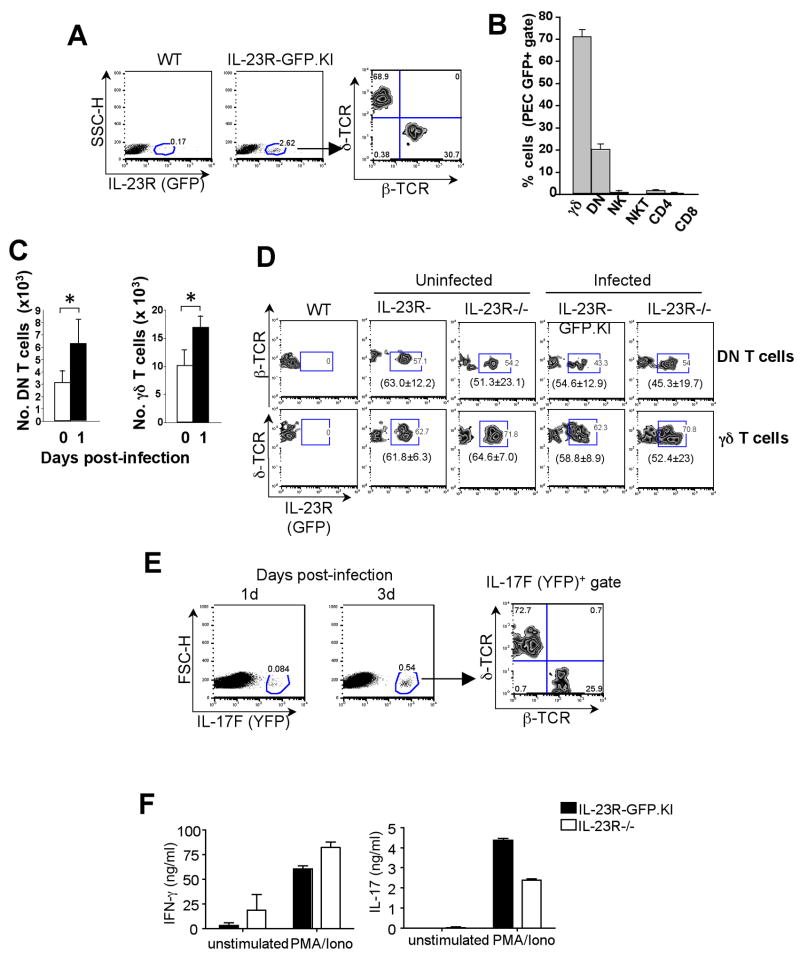
Figure 1. Expression of IL-23R in the peritoneal cavity of L. monocytogenes-infected mice.
Mice were infected via the intraperitoneal route with viable L. monocytogenes. (A, B, C, D and F) 24 h or 72 h (E) after infection. PEC were collected from WT, IL-23R-GFP.KI or IL-23R−/− (A, B, C, D and F) or IL-17F-CreEYFP (E) mice and β–TCR and δ–TCR surface stainings were performed. (A) IL-23R expression was analyzed in PEC of IL-23R-GFP.KI mice (B) Percentages of IL-23R (GFP)+ expressing cells were calculated within δ–TCR+, DN, CD4+, CD8+, NK1.1+, CD49b+ cell populations isolated from the peritoneal cavity of infected IL-23R-GFP.KI mice. The bars represent mean ± SD of 3 independent experiments (3 mice/group/experiment). (C) Histograms represent total numbers of γδ and DN collected from the peritoneum of IL-23R-GFP.KI mice 1d after infection. [*p<0.05 (two tail Student t-test)]. (D) The zebra plots represent the IL-23R (GFP) expression of peritoneal γδ or DN T cells from IL-23R-GFP.KI or IL-23R−/− mice 1 day after infection. In brackets, mean ± SD of 3 experiments with 3 mice/group is shown. (E) 1 d after infection, IL-23R-GFP.KI or IL-23R−/− PEC were isolated and stimulated or not with PMA/Ionomycin for an additional 18 h. Supernatants were collected and cytokine ELISA was performed for IL-17 and IFN-γ. Data shown are representative of 2 experiments with 3 mice/group. (F) 4× 10⁶ PEC where cultured in the presence of PMA/Ionomicin. After 24h the supernatants were collected and ELISA for IL-17 and INF-γ were performed.

